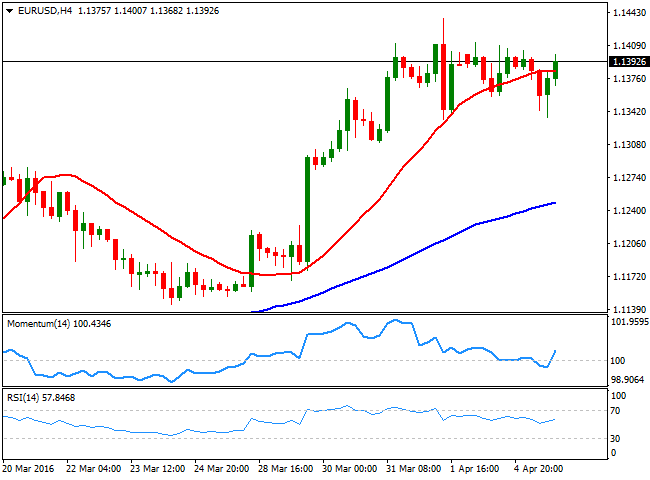
EUR/USD Current Price: 1.1392
View Live Chart for the EUR/USD
The American dollar attempt to comeback this Tuesday, but was unable to sustain its gains, particularly against the EUR and the JPY, as risk aversion dominate the financial world. Poor Japanese data sent the Nikkei nose diving at the beginning of the day, as the BOJ finally acknowledged that easing economic policies are not enough. European equities plummeted, fueled by tepid EU Services and Composite PMI figures, showing growth decelerated by the end of the first quarter of the year. Also, German factory orders fell 1.2% in February, although retail trade in the EU increased 0.2% monthly basis, and 2.4% compared to a year before.
In the US, data came in mixed, as the trade balance deficit widened to $47.06B, whilst total jobs opening in February reached 5.445M, slightly below expectations. The Markit services PMI surged to 51.3, while the ISM non-manufacturing PMI printed 54.5, the highest in three month. In balance, data were pretty encouraging, but not enough to revert the negative tone of the greenback.
The EUR/USD pair remained confined within Friday's range, flirting with the 1.1400 level by the end of the day and after trading as low as 1.1335 on the back of US strong services PMI readings, maintaining a neutral technical stance, but with bulls clearly not ready to give up. From a technical point of view, the risk remains towards the upside, particularly as the pair remains near its yearly high set last week at 1.1437, and intraday dips continue to attract buying interest. In the 4 hours chart, the technical indicators have turned north within neutral territory, while the price is hovering around a flat 20 SMA, suggesting the market will continue in wait and see mode, ahead of the upcoming minutes from both Central Banks and the wording of Draghi and Yellen next Thursday.
Support levels: 1.1330 1.1280 1.1245
Resistance levels: 1.1410 1.1460 1.1500
EUR/JPY Current price: 125.55
View Live Chart for the EUR/JPY
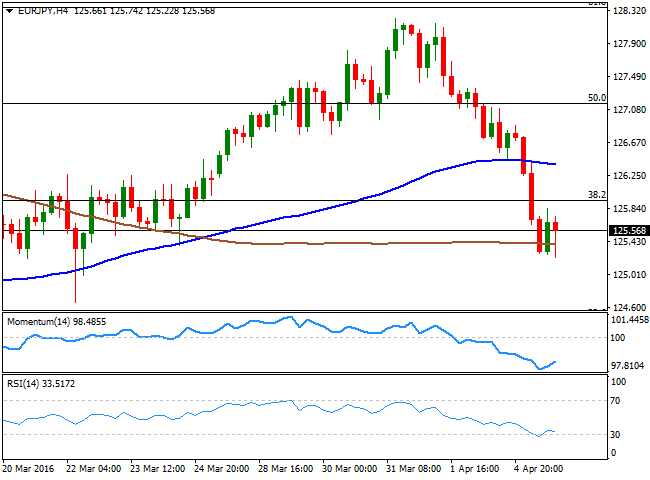
The EUR/JPY pair plummeted to 125.22 a fresh 2-week low, and trades a handful of pips above it, as the day comes to an end, with the Japanese yen being on demand ever since the day started, as poor Japanese data spurred risk aversion, leading to strong gains in the safe-haven yen. After testing the 61.8% retracement of its latest daily decline on Friday, the pair is currently trading below the 38.2% retracement of the same decline, around 125.95, indicating bears have taken over the pair. The short term picture shows that most of the action occurred in the previous Asian session, and that the pair has been pretty much consolidating during the European and American sessions, as EUR demand has prevented the pair from falling further. In the 1 hour chart, the price is far below its 100 and 200 SMAs, while the technical indicators have resumed their declines within bearish territory, after erasing extreme oversold readings. In the 4 hours chart, the Momentum indicators is aiming to bounce from oversold levels, but the RSI indicator keeps heading lower around 32, supporting additional declines for the upcoming Asian session.
Support levels: 125.20 124.80 124.40
Resistance levels: 125.95 126.60 127.00
GBP/USD Current price: 1.4146
View Live Chart for the GBP/USD
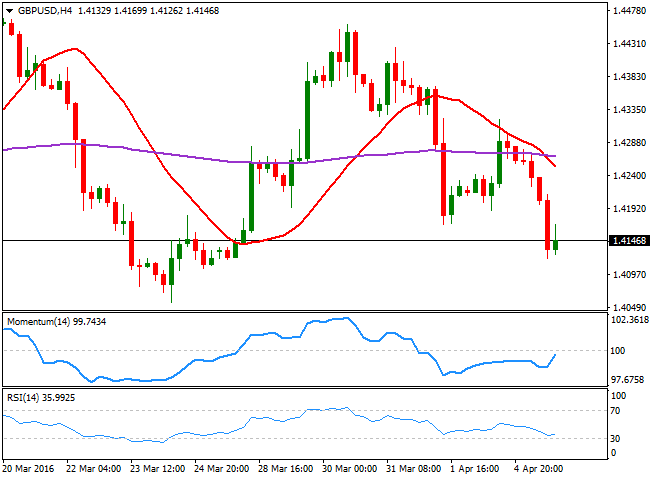
The British Pound resumed its decline against the greenback, falling down to 1.4121 as investors dumped the weakened high yielder in a risk aversion environment. The UK released its services PMI for March, up to 53.7, beating expectations of 53.5 and above February's reading of 52.7. With almost no changes in the manufacturing and construction PMIs, the overall composite index rose to 53.6 in March from the previous 52.7. The news, however, were not enough to support the Pound, as market traded mostly on sentiment. Technically, the 1 hour chart shows that the technical indicators keep heading south near oversold levels as the 20 SMA turned sharply lower above the current level, now around 1.4210, maintaining the risk towards the downside. In the 4 hours chart, the 20 SMA is extending below the 200 EMA in the 1.4260/70 region, while the technical indicators have managed to post a tepid bounce from oversold readings, but remain well into the red. The price is now being capped by short term selling interest around 1.4170, last Friday's low and the immediate resistance. Nevertheless, it will take a steeper recovery beyond 1.4250 to revert the current negative tone and see the pair attempting to regain the 1.4300 figure.
Support levels: 1.4115 1.4080 1.4035
Resistance levels: 1.4170 1.4210 1.4250
USD/JPY Current price: 110.26
View Live Chart for the USD/JPY
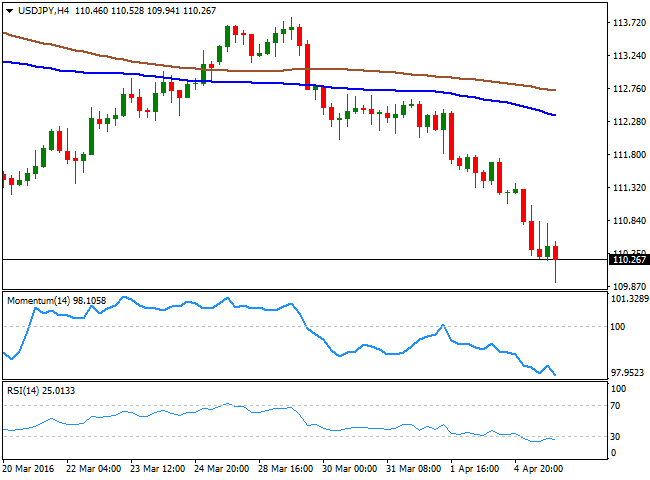
The Japanese yen rallied to a fresh 18-month high against the greenback, with the USD/JPY reaching 109.94 before bouncing some. The catalyst for yen's gains was the release of poor local data, as the March Nikkei PMI showed that the composite index fell to 49.9, below 50 for the first time this year. The services reading fell down to 50.0, also the lowest for the year. Adding to poor data was BOJ's Governor Kuroda, saying in a parliament committee that monetary policy can’t solve all economic issues, but also adding that he is willing to cut rate further. Nevertheless the initial headline sent local share markets down, and the negative mood prevailed all through the day. The bearish potential has gathered momentum, and the pair can now extend its decline down to 106.20 during the upcoming days, a major static long term support. In the meantime, the 1 hour chart shows that the technical indicators have corrected extreme oversold reading but remain well into the red, as the 100 SMA accelerated its decline well above the current level. In the 4 hours chart, the technical indicators keep heading lower, despite being in extreme oversold territory, in line with a continued decline for this Wednesday.
Support levels: 109.90 109.50 109.10
Resistance levels: 110.70 111.20 111.60
AUD/USD Current price: 0.7522
View Live Chart for the AUD/USD
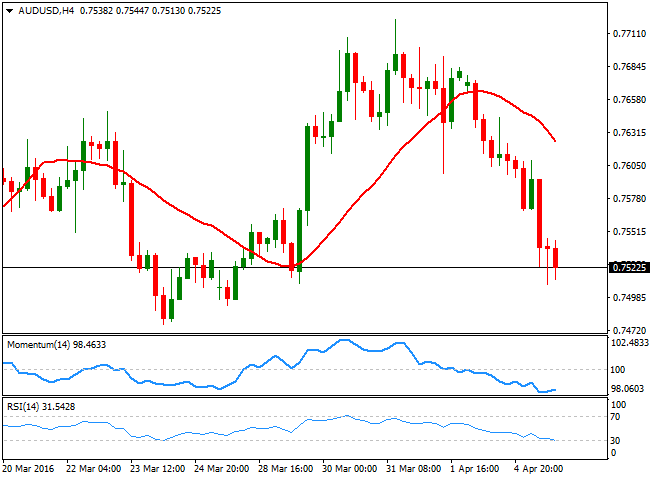
The Australian dollar fell against its American counterpart, weighed by falling stocks, and the RBA decisions. As largely expected, the Reserve Bank of Australia left its benchmark rate at a record low 2%, but expressed some concerns over the strengthening AUD, as Governor Stevens said that “under present circumstances, an appreciating exchange rate could complicate the adjustment under way in the economy.” The pair fell down to 0.7509, its lowest for the week, and seem poised to extend its decline that anyway looks corrective in the long term, given that the pair is barely around the 23.6% retracement of this year's bullish run. In the short term and for the upcoming sessions, the risk is towards downside, as in the 1 hour chart, the pair is well below a bearish 20 SMA, whilst the technical indicators have been consolidating in oversold territory, slowly turning south ahead of the Asian opening. In the 4 hours chart, the overall picture is also bearish, with the RSI indicating heading firmly lower around 31, and supporting a decline down to 0.7380, the 38.2% retracement of the mentioned rally.
Support levels: 0.7500 0.7460 0.7425
Resistance levels: 0.7540 0.7575 0.7620
Information on these pages contains forward-looking statements that involve risks and uncertainties. Markets and instruments profiled on this page are for informational purposes only and should not in any way come across as a recommendation to buy or sell in these assets. You should do your own thorough research before making any investment decisions. FXStreet does not in any way guarantee that this information is free from mistakes, errors, or material misstatements. It also does not guarantee that this information is of a timely nature. Investing in Open Markets involves a great deal of risk, including the loss of all or a portion of your investment, as well as emotional distress. All risks, losses and costs associated with investing, including total loss of principal, are your responsibility. The views and opinions expressed in this article are those of the authors and do not necessarily reflect the official policy or position of FXStreet nor its advertisers. The author will not be held responsible for information that is found at the end of links posted on this page.
If not otherwise explicitly mentioned in the body of the article, at the time of writing, the author has no position in any stock mentioned in this article and no business relationship with any company mentioned. The author has not received compensation for writing this article, other than from FXStreet.
FXStreet and the author do not provide personalized recommendations. The author makes no representations as to the accuracy, completeness, or suitability of this information. FXStreet and the author will not be liable for any errors, omissions or any losses, injuries or damages arising from this information and its display or use. Errors and omissions excepted.
The author and FXStreet are not registered investment advisors and nothing in this article is intended to be investment advice.
Recommended Content
Editors’ Picks
EUR/USD clings to daily gains above 1.0650

EUR/USD gained traction and turned positive on the day above 1.0650. The improvement seen in risk mood following the earlier flight to safety weighs on the US Dollar ahead of the weekend and helps the pair push higher.
GBP/USD recovers toward 1.2450 after UK Retail Sales data

GBP/USD reversed its direction and advanced to the 1.2450 area after touching a fresh multi-month low below 1.2400 in the Asian session. The positive shift seen in risk mood on easing fears over a deepening Iran-Israel conflict supports the pair.
Gold holds steady at around $2,380 following earlier spike

Gold stabilized near $2,380 after spiking above $2,400 with the immediate reaction to reports of Israel striking Iran. Meanwhile, the pullback seen in the US Treasury bond yields helps XAU/USD hold its ground.
Bitcoin Weekly Forecast: BTC post-halving rally could be partially priced in Premium

Bitcoin price shows no signs of directional bias while it holds above $60,000. The fourth BTC halving is partially priced in, according to Deutsche Bank’s research.
Week ahead – US GDP and BoJ decision on top of next week’s agenda

US GDP, core PCE and PMIs the next tests for the Dollar. Investors await BoJ for guidance about next rate hike. EU and UK PMIs, as well as Australian CPIs also on tap.