EUR/USD Current Price: 1.1374
View Live Chart for the EUR/USD
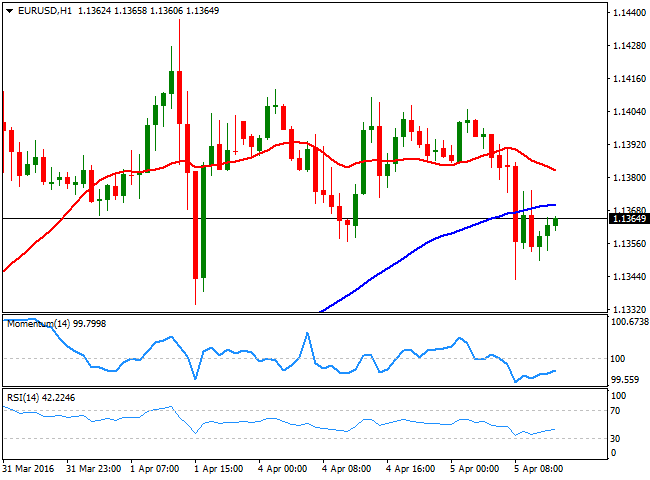
The EUR/USD pair trades slightly lower this Tuesday, having been unable to rally beyond the 1.1400 level ever since the week started. Nevertheless, the downside remains limited, in spite of the ongoing risk aversion sentiment, as the pair stands pretty much unchanged from its weekly opening. Data coming from Europe showed that March final Services PMI missed expectations, reflecting a sluggish growth in the sector during the first quarter of this 2016. Ahead of the release of US PMI non-manufacturing figures, the 1 hour chart for the pair shows that the price is below its 20 and 100 SMAs, whilst the technical indicators have bounced partially from oversold levels, but remain below their mid-lines, indicating no actual bullish strength. In the 4 hours chart, the pair is also developing below a now flat 20 SMA, whilst the Momentum indicator heads south below the 100 level, and the RSI hovers around 53, lacking clear directional strength. The pair will likely remain range bound ahead of upcoming ECB and FED's events on Wednesday and Thursday, with the downward potential remaining limited as long as the price remains above the 1.1280 immediate support.
Support levels: 1.1330 1.1280 1.1245
Resistance levels: 1.1410 1.1460 1.1500
GBP/USD Current price: 1.4179
View Live Chart for the GBP/USD
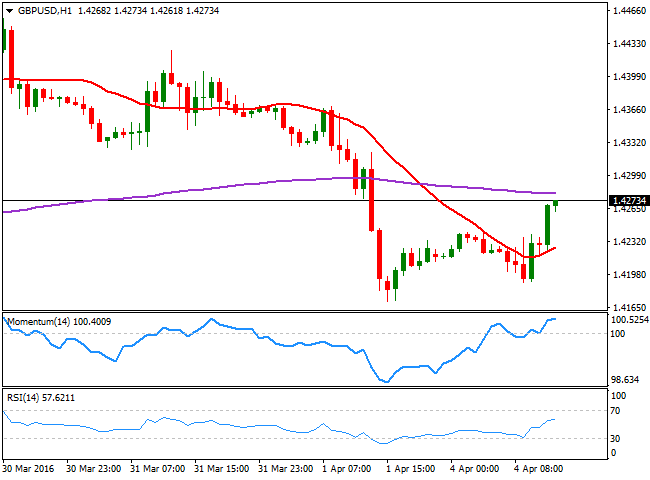
The GBP/USD pair extended its decline this Tuesday, and pressures 1.4170, Friday's low and the immediate support. The Sterling came under pressure after the release of the UK Services PMI for March, which resulted at 53.7, below the 54.0 expected, although above the previous 52.7. Also, weighing on Pound are lower oil prices, as the commodity returned to $ 35.00 a barrel on news an output freeze seems less likely. Technically, the 1 hour chart presents a strong bearish tone, as the technical indicators keep heading south, despite being near oversold readings, whilst the 20 SMA has turned south above the current level. In the 4 hours chart, the 20 SMA is crossing below the 200 EMA n the 1.4270 region, while the RSI indicator maintains its bearish slope well below its mid-line, supporting some additional declines for the upcoming hours.
Support levels: 1.4170 1.4140 1.4100
Resistance levels: 1.4220 1.4270 1.4315
USD/JPY Current price: 110.59
View Live Chart for the USD/JPY
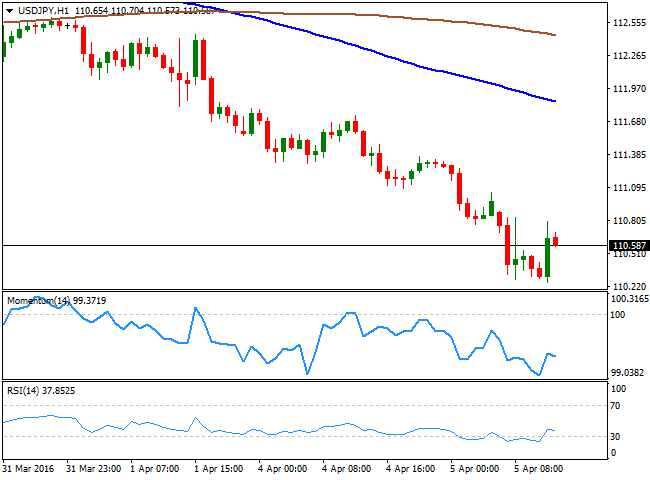
Downward potential increases. The Japanese yen appreciated further during the past Asian session as local share markets plummeted, fueling demand for safe-haven assets. The USD/JPY fell down to 110.25, a level not seen since October 2014, and the following bounce was unable to reach the 111.00 figure, despite the BOJ offered its usual jawboning: chief cabinet secretary Suga said that authorities are watching FX movements with a "sense of urgency." The pair has corrected extreme oversold readings, but maintains a strong bearish tone, both short and long term, indicating a strong possibility of a break below 110.00, which may fuel the decline, despite the BOJ. The 1 hour chart shows that the price is well below its 100 and 200 SMAs, while the technical indicators have turned lower within bearish territory after correcting extreme oversold readings. In the 4 hours chart, the technical indicators have recovered partially within oversold territory, but with the price around its lows and far below its moving averages, the risk remains towards the downside.
Support levels: 110.25 109.90 109.50
Resistance levels: 110.70 111.20 111.60
AUD/USD Current price: 0.7538
View Live Chart for the AUD/USD
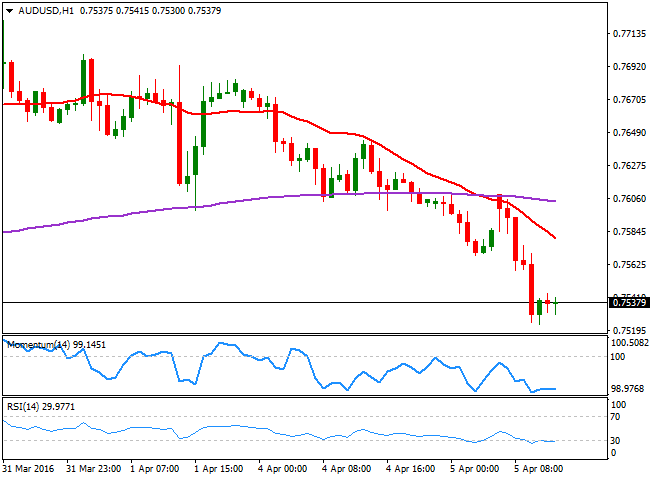
The AUD/USD pair fell to its lowest for the week on a worried RBA, as the Australian Central Bank expressed concerns over the strength of the Aussie. The pair seems to be finally poised to correct lower, particularly on a break below the 0.7500 figure, although the self strength of the Australian economy and the broad dollar's weakness suggests that the decline won't be as extended as the RBA pretends. Technically and for the short term, the 1 hour chart shows that the price remains near its daily low and well below a strongly bearish 20 SMA, whilst the technical indicators have turned flat within oversold territory. In the 4 hours chart, the price is well below a bearish 20 SMA, while the technical indicators have also lost downward potential, but remains near oversold territory with no signs of changing bias, maintaining the risk towards the downside.
Support levels: 0.7500 0.7460 0.7425
Resistance levels: 0.7540 0.7575 0.7620
Information on these pages contains forward-looking statements that involve risks and uncertainties. Markets and instruments profiled on this page are for informational purposes only and should not in any way come across as a recommendation to buy or sell in these assets. You should do your own thorough research before making any investment decisions. FXStreet does not in any way guarantee that this information is free from mistakes, errors, or material misstatements. It also does not guarantee that this information is of a timely nature. Investing in Open Markets involves a great deal of risk, including the loss of all or a portion of your investment, as well as emotional distress. All risks, losses and costs associated with investing, including total loss of principal, are your responsibility. The views and opinions expressed in this article are those of the authors and do not necessarily reflect the official policy or position of FXStreet nor its advertisers. The author will not be held responsible for information that is found at the end of links posted on this page.
If not otherwise explicitly mentioned in the body of the article, at the time of writing, the author has no position in any stock mentioned in this article and no business relationship with any company mentioned. The author has not received compensation for writing this article, other than from FXStreet.
FXStreet and the author do not provide personalized recommendations. The author makes no representations as to the accuracy, completeness, or suitability of this information. FXStreet and the author will not be liable for any errors, omissions or any losses, injuries or damages arising from this information and its display or use. Errors and omissions excepted.
The author and FXStreet are not registered investment advisors and nothing in this article is intended to be investment advice.
Recommended Content
Editors’ Picks
EUR/USD clings to daily gains above 1.0650

EUR/USD gained traction and turned positive on the day above 1.0650. The improvement seen in risk mood following the earlier flight to safety weighs on the US Dollar ahead of the weekend and helps the pair push higher.
GBP/USD recovers toward 1.2450 after UK Retail Sales data

GBP/USD reversed its direction and advanced to the 1.2450 area after touching a fresh multi-month low below 1.2400 in the Asian session. The positive shift seen in risk mood on easing fears over a deepening Iran-Israel conflict supports the pair.
Gold holds steady at around $2,380 following earlier spike

Gold stabilized near $2,380 after spiking above $2,400 with the immediate reaction to reports of Israel striking Iran. Meanwhile, the pullback seen in the US Treasury bond yields helps XAU/USD hold its ground.
Bitcoin Weekly Forecast: BTC post-halving rally could be partially priced in Premium

Bitcoin price shows no signs of directional bias while it holds above $60,000. The fourth BTC halving is partially priced in, according to Deutsche Bank’s research.
Week ahead – US GDP and BoJ decision on top of next week’s agenda

US GDP, core PCE and PMIs the next tests for the Dollar. Investors await BoJ for guidance about next rate hike. EU and UK PMIs, as well as Australian CPIs also on tap.