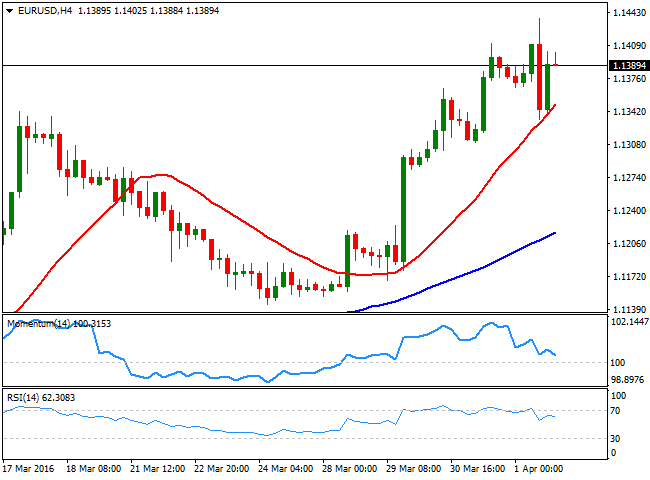
EUR/USD Current Price: 1.1389
View Live Chart for the EUR/USD
A fairly encouraging US Nonfarm Payroll report was not enough to change market's sentiment towards the American currency, which closed Friday generally lower across the board, except against the Pound, down on self-weakness. The US labour report showed that the economy added 215K new jobs, slightly above consensus, while the unemployment rate ticked back up to 5.0%. Wages improved from February's slump into negative territory, up by 0.3% compared to the previous month, and taking the year-on-year reading up to 2.3%. The greenback saw some demand after the release, fueled by a positive ISM manufacturing index, up to 51.8 from 49.5 in February, and profit taking ahead of the weekend. Total construction spending for February however, fell 0.5%. During the upcoming week, the ECB and the FED will release the Minutes of their latest meetings, but seems unlikely they will be capable to change the downbeat tone of the dollar.
Gains in the American currency were short-lived, and speculators decide to sell it back at better levels, resulting in the EUR/USD pair closing at its highest for the year, at 1.1389. The pair earlier set a high at 1.1437, close enough to the 1.1460 price zone that has steadily attracted selling interest ever since the beginning of 2015. The pair has rallied for five consecutive days, and the daily chart shows that it has posted higher highs and higher lows, which favors further gains into next week, despite the technical indicators have lost upward strength near overbought levels. Still, the mentioned 1.1460 region is a tough bone to break, and a clear break of the area is required to confirm further gains towards the 1.1500 level. In the shorter term, the 4 hours chart, the pair has bounced sharply after testing a bullish 20 SMA, currently around 1.1360, the immediate short term support, whilst the technical indicators present some bearish divergences, yet to be confirmed with an acceleration through their mid-lines. Should these lasts bounce back, the downward potential will remain limited, indicating the market is still willing to buy the dips.
Support levels: 1.1360 1.1320 1.1280
Resistance levels: 1.1410 1.1460 1.1500
EUR/JPY Current price: 127.15
View Live Chart for the EUR/JPY
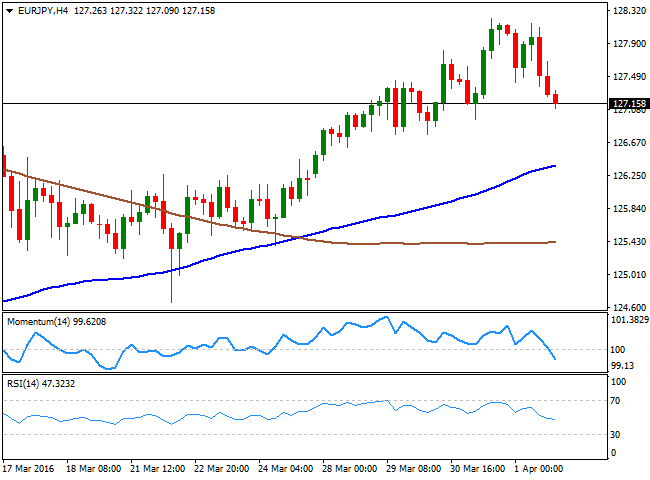
A weaker-than-expected Tankan report for the Q1 of this 2016 spurred risk aversion during the past Asian session, resulting in the Nikkei plummeting and the JPY rising against all of its major rivals. The Japanese currency further gain after the release of the US data, resulting in the EUR/JPY shedding around 100 pips daily basis, to close the week with gains around 127.15. The latest advance, however, has stalled at a major resistance level, as the pair presents its 100 DMA and the 61.8% retracement of the 132.27/122.02 decline around 128.40. The daily chart also shows that the technical indicators have retreated from near overbought levels and turned south, still holding within positive territory, whilst the price is currently struggling with the 50% of the mentioned rally. Shorter term, and according to the 4 hour chart, the technical picture is mild bearish, given that the technical indicators have crossed their mid-lines towards the downside, and maintain their bearish slopes, although the price is well above a bullish 100 SMA, currently around 126.50. Overall, yen's strength will likely overshadow the common currency's one, but it will take a break below this last mentioned level to confirm a downward continuation for this week.
Support levels: 126.90 126.50 126.10
Resistance levels: 127.45 127.90 128.40
GBP/USD Current price: 1.4224
View Live Chart for the GBP/USD
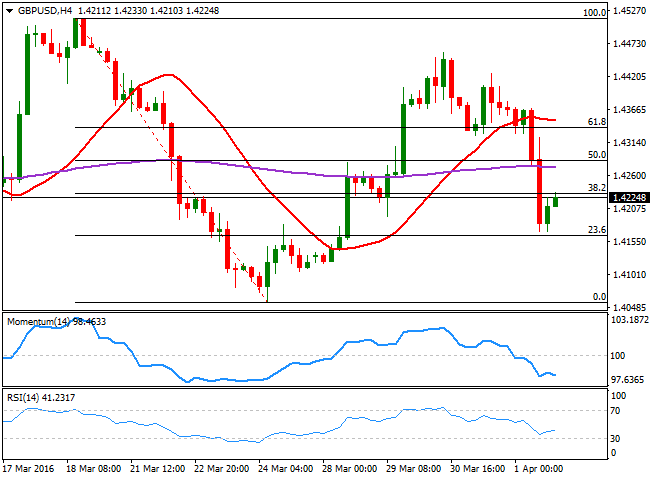
The Sterling was among the weakest currencies last Friday, plummeting after the release of the UK Markit manufacturing PMI for February, slightly better than the previous one, but coming in at 51.0, below market's consensus of 51.2. Also, uncertainty surrounding the result of the forthcoming referendum over a Brexit kept weighing over the Pound, suggesting the UK currency will continue to underperform. The GBP/USD pair closed the week at 1.4224 after bouncing from a low set at 1.4170, having erased most of its weekly gains. From a technical point of view, the daily chart shows that the price has broken below its 20 SMA, and that the technical indicators have crossed their mid-lines towards the downside, supporting further slides ahead. In the 4 hours chart, the pair is right below the 38.2% retracement of its latest decline, while the 20 SMA has turned south around 1.4350. In this last time frame, the latest bounce was not enough to revert the negative slope of the Momentum indicator that continues heading south near oversold levels, whilst the RSI has posted a tepid bounce, but stands around 41. Renewed selling pressure below the mentioned low, should open doors for a test of the psychological 1.4000 level sometime this week, while a break below it exposes the pair to a steady decline down to 1.3501, January 2009 low.
Support levels: 1.4210 1.4170 1.4125
Resistance levels: 1.4285 1.4330 1.4370
USD/JPY Current price: 111.64
View Live Chart for the USD/JPY
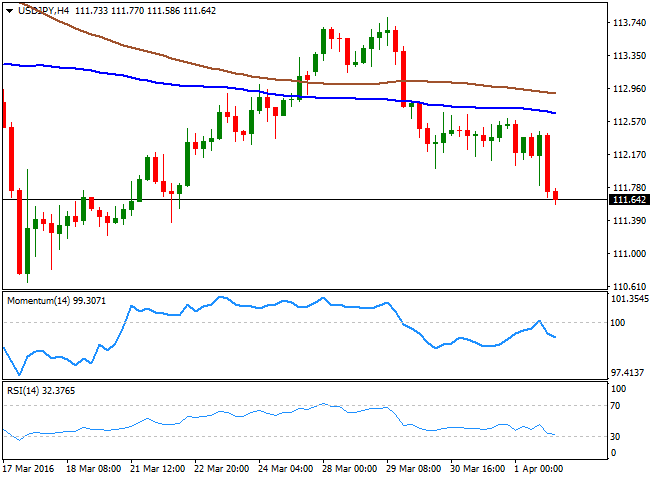
The Japanese yen strengthened all through last Friday, fueled by a sharp decline in the Nikkei 225, after the Tankan report showed that business confidence among large manufacturers declined sharply from +12 in Q4 to +6 in Q1, reaching its lowest level since Q2 2013. Speculative interest turned to safe-havens ahead of the release of the US Nonfarm Payroll report, which anyway, was not enough to prevent the USD/JPY from breaking below the 112.00 critical support, and accelerating its decline. Having closed the week at 111.64, the technical picture is clearly bearish in the daily chart, as the price remains far below a sharply bearish 100 DMA, whilst the technical indicators head south within bearish territory. In the 4 hours chart the technical indicators retreated from their mid-lines, and maintain strong bearish slopes, indicating the pair may fall further, particularly on a break below 111.50, the immediate support. Given that Wall Street turned higher by the close, the weekly opening may see some risk appetite, which may result in a recovery of the USD/JPY pair back above the 112.00 mark, but it will take further gains beyond the 112.60 region to see take off some of the bearish pressure on the pair, and signal some further short term gains for this Monday.
Support levels: 111.50 111.00 110.65
Resistance levels: 1112.00 112.60 113.10
AUD/USD Current price: 0.7680
View Live Chart for the AUD/USD
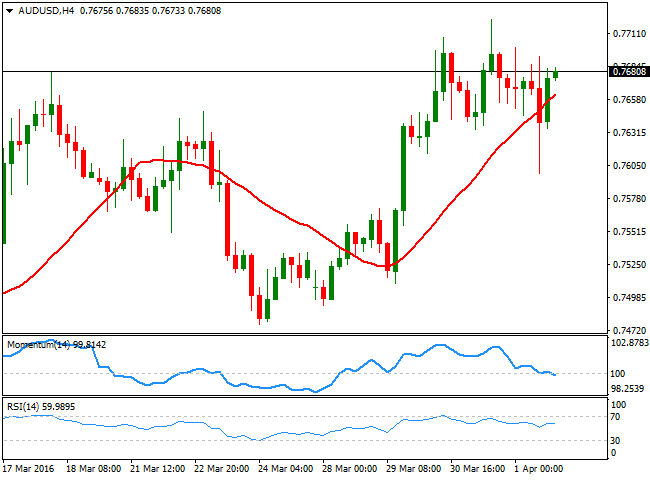
The AUD/USD pair ended the week at 0.7680, its highest daily close since June 2015, underpinned by Australian March manufacturing PMI that surged to the highest since 2004 to 58.1, in line with the strong local growth, anticipated by other macroeconomic reports. Also, supporting the Aussie was an uptick in Chinese data, as the official manufacturing PMI printed 50.2 in March from 49 in February, beating expectations of 49.4, while the non-manufacturing PMI rose to 53.8 from 52.7 in the previous month. The daily chart shows that a decline down to 0.7598 was quickly reversed, indicating that market is still eager to buy the dips in the pair. In the same chart, the price remains well above a firmly bullish 20 SMA, although the technical indicators have lost upward strength near overbought levels, and the Momentum indicator particularly, has turned lower. In the 4 hours chart, the price remains above a bullish 20 SMA, but the technical indicators have turned slightly lower within neutral territory, indicating diminishing buying interest around 0.7700. Nevertheless, a clear break above last week high of 0.7722 should lead to a continued advance, up to 0.7800 in the short term, but closer to the 0.8000 mark, later on the week.
Support levels: 0.7650 0.7620 0.7570
Resistance levels: 0.7725 0.7765 0.7800
Information on these pages contains forward-looking statements that involve risks and uncertainties. Markets and instruments profiled on this page are for informational purposes only and should not in any way come across as a recommendation to buy or sell in these assets. You should do your own thorough research before making any investment decisions. FXStreet does not in any way guarantee that this information is free from mistakes, errors, or material misstatements. It also does not guarantee that this information is of a timely nature. Investing in Open Markets involves a great deal of risk, including the loss of all or a portion of your investment, as well as emotional distress. All risks, losses and costs associated with investing, including total loss of principal, are your responsibility. The views and opinions expressed in this article are those of the authors and do not necessarily reflect the official policy or position of FXStreet nor its advertisers. The author will not be held responsible for information that is found at the end of links posted on this page.
If not otherwise explicitly mentioned in the body of the article, at the time of writing, the author has no position in any stock mentioned in this article and no business relationship with any company mentioned. The author has not received compensation for writing this article, other than from FXStreet.
FXStreet and the author do not provide personalized recommendations. The author makes no representations as to the accuracy, completeness, or suitability of this information. FXStreet and the author will not be liable for any errors, omissions or any losses, injuries or damages arising from this information and its display or use. Errors and omissions excepted.
The author and FXStreet are not registered investment advisors and nothing in this article is intended to be investment advice.
Recommended Content
Editors’ Picks
EUR/USD clings to modest gains above 1.0650 ahead of US data

EUR/USD trades modestly higher on the day above 1.0650 in the early American session on Tuesday. The upbeat PMI reports from the Eurozone and Germany support the Euro as market focus shift to US PMI data.
GBP/USD extends rebound, tests 1.2400

GBP/USD preserves its recovery momentum and trades near 1.2400 in the second half of the day on Tuesday. The data from the UK showed that the private sector continued to grow at an accelerating pace in April, helping Pound Sterling gather strength against its rivals.
Gold flirts with $2,300 amid receding safe-haven demand

Gold (XAU/USD) remains under heavy selling pressure for the second straight day on Tuesday and languishes near its lowest level in over two weeks, around the $2,300 mark in the European session. Eyes on US PMI data.
Here’s why Ondo price hit new ATH amid bearish market outlook Premium

Ondo price shows no signs of slowing down after setting up an all-time high (ATH) at $1.05 on March 31. This development is likely to be followed by a correction and ATH but not necessarily in that order.
US S&P Global PMIs Preview: Economic expansion set to keep momentum in April

S&P Global Manufacturing PMI and Services PMI are both expected to come in at 52 in April’s flash estimate, highlighting an ongoing expansion in the private sector’s economic activity.