EUR/USD Current Price: 1.1389
View Live Chart for the EUR/USD
The EUR/USD trades at fresh year highs, right below the 1.1400 figure, as the market keeps selling the greenback above and beyond. Early data coming from Germany was far from encouraging, as local Retail Sales were down by 0.4% monthly basis in February, but strongly higher compared to a year before, up by 5.4%. In the same month, the unemployment rate during March remained unchanged at 6.2%, although the number of unemployed people was unchanged in March, the first month since last September the jobless total has not fallen. The US session will bring minor releases, with the market now focused on the Nonfarm Payroll report, to be released this Friday.
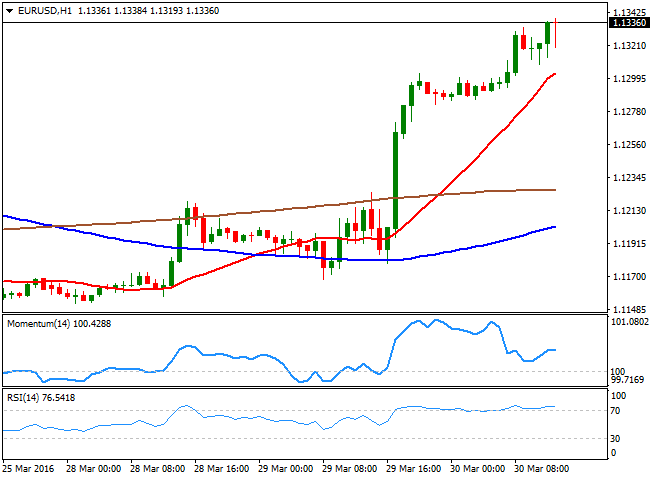
In the meantime, European indexes trade sharply lower, but US futures suggest another positive day for Wall Street, with the DJIA holding near the fresh year high posted yesterday. As for the 1 hour chart of the EUR/USD pair, its shows that the price has accelerated well above a bullish 20 SMA, whilst the technical indicators are partially losing upward strength within overbought levels, with no signs of changing bias and overall, favoring another leg north. In the 4 hours chart, the picture is pretty much the same, with indicators lacking upward momentum but holding in extreme overbought levels. A new leg north beyond 1.1410 should see the pair extending up to a major static resistance level at 1.1460, while beyond it, large stops are suspected and if triggered, will likely push the pair above the 1.1500 level.
Support levels: 1.1365 1.1330 1.1290
Resistance levels: 1.1410 1.1460 1.1500
GBP/USD Current price: 1.4370
View Live Chart for the GBP/USD
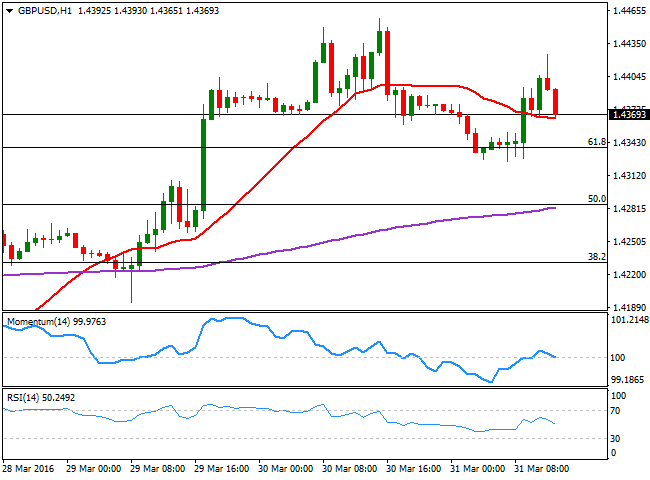
The GBP/USD pair stands around its daily opening, having been as high as 1.4425 so far today, after the release of the final version of the Q4 2015 GDP revised higher to 0.6% compared to the previous quarter, and 2.1% yearly basis. The boost given by the data has not been enough to send the pair above the previous weekly high, and this lack of follow through suggests the Pound may turn lower, at least in the short term. Technically, the 1 hour chart shows that the price is pressuring a flat 20 SMA, while the technical indicators have turned lower after crossing above their mid-lines, and hold in neutral territory. In the 4 hours chart, the 20 SMA maintains a strong upward slope, around 1.4325, also the daily low, while the technical indicators are turning south within positive territory, but having posted lower highs daily basis, indicating an increasing bearish potential that needs to be confirmed on a break below the mentioned support.
Support levels: 1.4325 1.4290 1.4250
Resistance levels: 1.4420 1.4460 1.4515
USD/JPY Current price: 112.31
View Live Chart for the USD/JPY
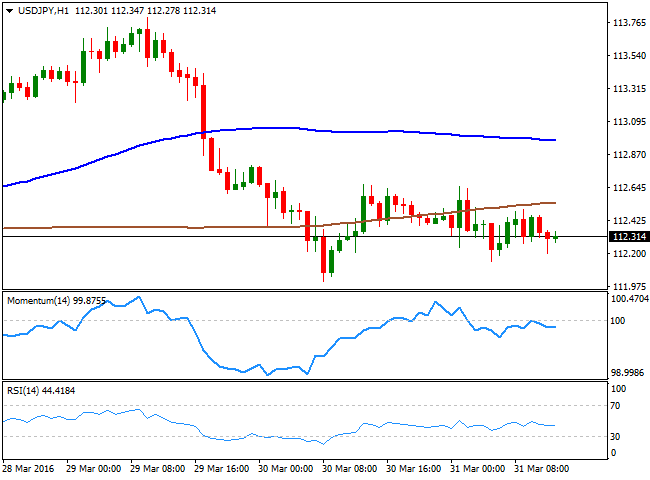
The USD/JPY pair trades within quite a limited range this Thursday, but overall heavy ahead of the US opening. The yen retains its strength amid broad dollar's weakness, weighting in Japanese shares, as the Nikkei plummeted, leading European shares lower. The short term technical picture presents a negative tone, although with limited potential at the time being, given that the technical indicators are holding directionless below their mid-lines. Also, the price is below its 100 and 200 SMAs, with the largest offering an immediate resistance around 112.60. In the 4 hours chart, the technical indicators head lower within negative territory, while the price stands below its moving averages, all of which maintains the risk towards the downside.
Support levels: 111.90 111.50 111.00
Resistance levels: 112.60 113.10 113.35
AUD/USD Current price: 0.7690
View Live Chart for the AUD/USD
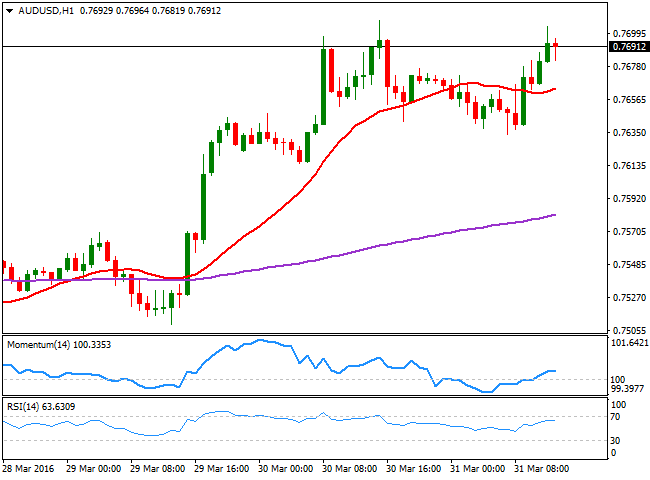
The AUD/USD pair recovered the ground lost and its now near the 0.7700 the level, retaining the bullish tone ahead of the US opening. The 1 hour chart shows that the price is well above its 20 SMA, whilst the technical indicators head higher within positive territory. In the 4 hours chart, the technical indicators head sharply higher near overbought territory, while the 20 SMA accelerated its advance below the current level, now around 0.7620, providing an immediate support.
Support levels: 0.7620 0.7570 0.7525
Resistance levels: 0.7710 0.7765 0.7800
Information on these pages contains forward-looking statements that involve risks and uncertainties. Markets and instruments profiled on this page are for informational purposes only and should not in any way come across as a recommendation to buy or sell in these assets. You should do your own thorough research before making any investment decisions. FXStreet does not in any way guarantee that this information is free from mistakes, errors, or material misstatements. It also does not guarantee that this information is of a timely nature. Investing in Open Markets involves a great deal of risk, including the loss of all or a portion of your investment, as well as emotional distress. All risks, losses and costs associated with investing, including total loss of principal, are your responsibility. The views and opinions expressed in this article are those of the authors and do not necessarily reflect the official policy or position of FXStreet nor its advertisers. The author will not be held responsible for information that is found at the end of links posted on this page.
If not otherwise explicitly mentioned in the body of the article, at the time of writing, the author has no position in any stock mentioned in this article and no business relationship with any company mentioned. The author has not received compensation for writing this article, other than from FXStreet.
FXStreet and the author do not provide personalized recommendations. The author makes no representations as to the accuracy, completeness, or suitability of this information. FXStreet and the author will not be liable for any errors, omissions or any losses, injuries or damages arising from this information and its display or use. Errors and omissions excepted.
The author and FXStreet are not registered investment advisors and nothing in this article is intended to be investment advice.
Recommended Content
Editors’ Picks
EUR/USD retreats below 1.0700 after US GDP data

EUR/USD came under modest bearish pressure and retreated below 1.0700. Although the US data showed that the economy grew at a softer pace than expected in Q1, strong inflation-related details provided a boost to the USD.
GBP/USD declines below 1.2500 as USD rebounds

GBP/USD declined below 1.2500 and erased the majority of its daily gains with the immediate reaction to the US GDP report. The US economy expanded at a softer pace than expected in Q1 but the price deflator jumped to 3.4% from 1.8%.
Gold holds near $2,330 despite rising US yields

Gold stays in positive territory near $2,330 in the second half of the day on Thursday. The benchmark 10-year US Treasury bond yield is up more than 1% on the day above 4.7% after US GDP report, making it difficult for XAU/USD to extend its daily rally.
XRP extends its decline, crypto experts comment on Ripple stablecoin and benefits for XRP Ledger

Ripple extends decline to $0.52 on Thursday, wipes out weekly gains. Crypto expert asks Ripple CTO how the stablecoin will benefit the XRP Ledger and native token XRP.
After the US close, it’s the Tokyo CPI

After the US close, it’s the Tokyo CPI, a reliable indicator of the national number and then the BoJ policy announcement. Tokyo CPI ex food and energy in Japan was a rise to 2.90% in March from 2.50%.


