EUR/USD Current Price: 1.1170
View Live Chart for the EUR/USD
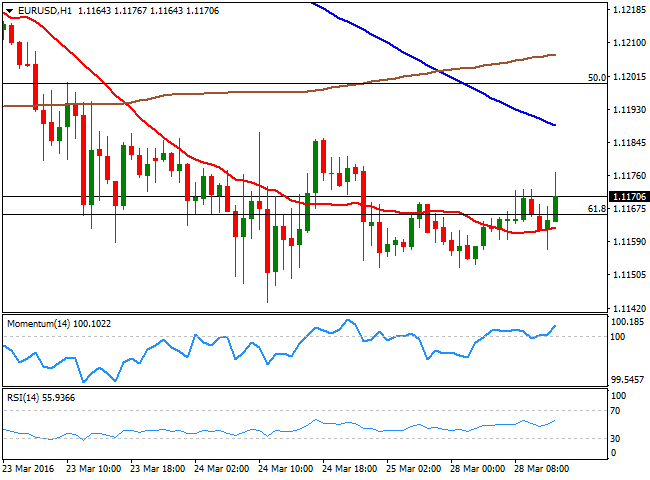
Markets remain thin, as the Easter Monday holiday kept European markets closed, as well as most of Asian ones. Japan worked normally, with the Nikkei advancing on the back of good industrial data released by China over the weekend, but beyond some yen's weakness, majors traded within its latest tight ranges. Ahead of the US opening, the US released several macroeconomic figures, which include a negative surprise, as CPE inflation came in worse than expected, down 0.1% in February. The Goods Trade Balance deficit widened to $63B, above market's expectations, all of which led to a tepid dollar decline, more due to the lack of liquidity than to dollar's strength. The EUR/USD pair 1 hour chart shows that the pair advanced up to 1.1176, with a very limited positive tone according to the 1 hour chart, as the price remains below its 100 and 200 SMAs, while it holds around the 61.8% retracement of the post-FED rally. In the 4 hours chart, the price is pressuring a bearish 20 SMA, a few pips above the current level, while the technical indicators aim higher, but are still below their mid-lines. Majors will likely react with Wall Street opening, and seems the dollar is not going to have a good day.
Support levels: 1.1120 1.1085 1.1040
Resistance levels: 1.1200 1.1245 1.1290
GBP/USD Current price: 1.4120
View Live Chart for the GBP/USD
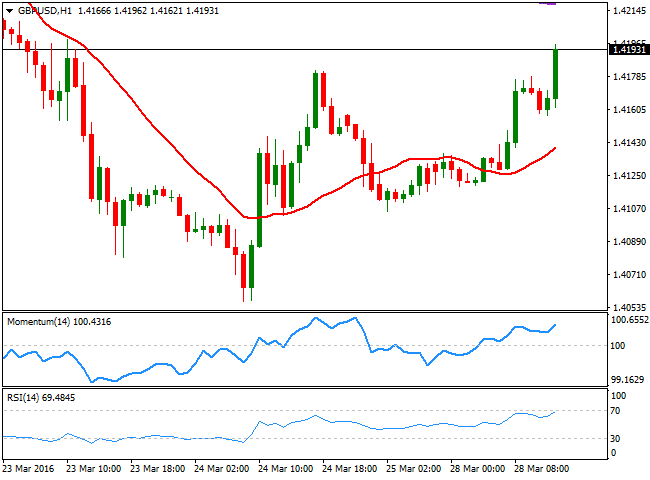
The British Pound traded generally higher across the board, although the GBP/USD pair remained below the 1.4200 level during the first half of the day, amid the lack of liquidity. Poor US data is sending the pair to the mentioned figure, and the short term picture is bullish, given that in the 1 hour chart, the price is accelerating above its 20 SMA, whilst the technical indicators head north within bullish territory. In the 4 hours chart, the technical indicators maintain their bullish slopes after crossing their mid-lines into positive territory, while the price advances above its 20 SMA for the first time in almost a week, all of which supports some further gains, particularly if the pair manages to extend beyond 1.4210, the immediate resistance.
Support levels: 1.4155 1.4100 1.4050
Resistance levels: 1.4210 1.4260 1.4300
USD/JPY Current price: 113.30
View Live Chart for the USD/JPY
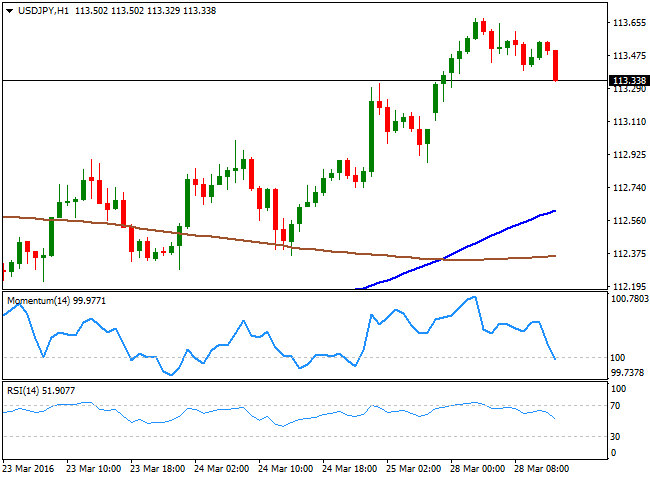
Down from 113.60 as US data disappoints. The Japanese yen weakened during the past Asian session, on renewed speculation Prime Minister Abe will announce a fiscal stimulus plan and delay the increase of the sales tax, this Tuesday. The USD/JPY advanced up to 113.59, holding nearby during the European session. US data is pushing the pair lower, as CPE inflation fell into negative territory in February, which means the FED has less room to raise rates. The USD/JPY 1 hour chart shows that the technical indicators have crossed their mid-lines towards the downside with a strong bearish slope, although the price remains above the 100 and 200 SMAs, with the shortest around 112.50. In the 4 hours chart, the price remains above its moving averages that anyway maintain soft bearish slopes, while the Momentum indicator remains flat within positive territory. The RSI indicator is retreating from overbought territory, all of which suggests a short term slide but fails to confirm it. Should the price break accelerate below the 113.00 region, the pair has then scope to test the 112.00 region later on the day.
Support levels: 112.90 112.50 112.00
Resistance levels: 113.60 114.00 114.45
AUD/USD Current price: 0.7546
View Live Chart for the AUD/USD
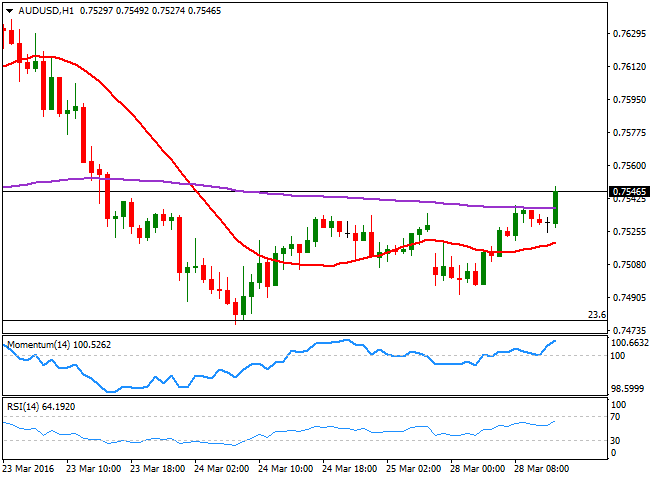
As commodities post shallow advances, the AUD/USD pair gained at the beginning of the day, accelerating now ahead of the US opening, and reaching fresh daily highs in the 0.7550 region. The pair met buying interest last week around 0.7480, the 23.6% retracement of the latest daily bullish run, which keeps the long term bullish trend firm in place, despite the negative close seen last week. In the short term, the 1 hour chart shows that the price is above its 20 SMA, whilst the technical indicators aim higher above their mid-lines, in line with further advances. In the 4 hours chart, the price is crossing above a bearish 20 SMA, while the technical indicators are crossing their mid-lines towards the upside with limited upward strength, also supporting a continued advance.
Support levels: 0.7510 0.7475 0.7440
Resistance levels: 0.7560 0.7605 0.7640
Information on these pages contains forward-looking statements that involve risks and uncertainties. Markets and instruments profiled on this page are for informational purposes only and should not in any way come across as a recommendation to buy or sell in these assets. You should do your own thorough research before making any investment decisions. FXStreet does not in any way guarantee that this information is free from mistakes, errors, or material misstatements. It also does not guarantee that this information is of a timely nature. Investing in Open Markets involves a great deal of risk, including the loss of all or a portion of your investment, as well as emotional distress. All risks, losses and costs associated with investing, including total loss of principal, are your responsibility. The views and opinions expressed in this article are those of the authors and do not necessarily reflect the official policy or position of FXStreet nor its advertisers. The author will not be held responsible for information that is found at the end of links posted on this page.
If not otherwise explicitly mentioned in the body of the article, at the time of writing, the author has no position in any stock mentioned in this article and no business relationship with any company mentioned. The author has not received compensation for writing this article, other than from FXStreet.
FXStreet and the author do not provide personalized recommendations. The author makes no representations as to the accuracy, completeness, or suitability of this information. FXStreet and the author will not be liable for any errors, omissions or any losses, injuries or damages arising from this information and its display or use. Errors and omissions excepted.
The author and FXStreet are not registered investment advisors and nothing in this article is intended to be investment advice.
Recommended Content
Editors’ Picks
EUR/USD clings to gains near 1.0700, awaits key US data

EUR/USD clings to gains near the 1.0700 level in early Europe on Thursday. Renewed US Dollar weakness offsets the risk-off market environment, supporting the pair ahead of the key US GDP and PCE inflation data.
USD/JPY keeps pushing higher, eyes 156.00 ahead of US GDP data

USD/JPY keeps breaking into its highest chart territory since June of 1990 early Thursday, recapturing 155.50 for the first time in 34 years as the Japanese Yen remains vulnerable, despite looming intervention risks. The focus shifts to Thursday's US GDP report and the BoJ decision on Friday.
Gold closes below key $2,318 support, US GDP holds the key

Gold price is breathing a sigh of relief early Thursday after testing offers near $2,315 once again. Broad risk-aversion seems to be helping Gold find a floor, as traders refrain from placing any fresh directional bets on the bright metal ahead of the preliminary reading of the US first-quarter GDP due later on Thursday.
Injective price weakness persists despite over 5.9 million INJ tokens burned

Injective price is trading with a bearish bias, stuck in the lower section of the market range. The bearish outlook abounds despite the network's deflationary efforts to pump the price.
Meta takes a guidance slide amidst the battle between yields and earnings

Meta's disappointing outlook cast doubt on whether the market's enthusiasm for artificial intelligence. Investors now brace for significant macroeconomic challenges ahead, particularly with the release of first-quarter GDP data.


