EUR/USD Current Price: 1.1099
View Live Chart for the EUR/USD
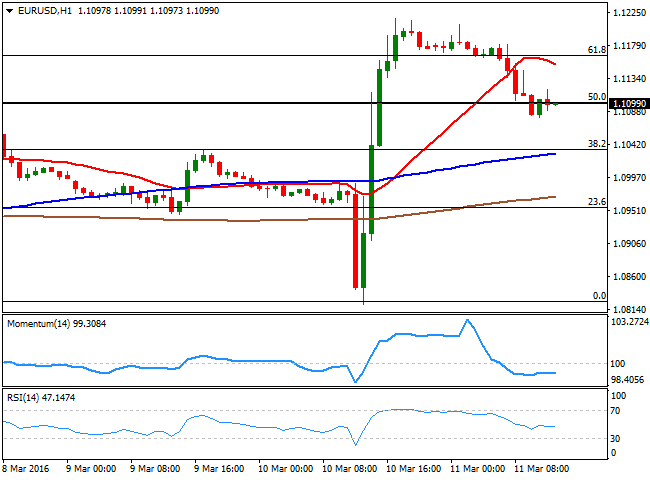
Markets have come to their senses after yesterday's wild roller-coaster ride, and European equities recovered most of the ground lost yesterday during the London session. Data coming from Germany showed that inflation remained stable near its lows, up 0.4% in February, as expected. The year-on-year figure came in at -0.8% matching expectations but below the previous month figure of -0.3%. Wholesale prices in the country, declined by 1.9%, doubling previous month figure of -1.0%. The EUR/USD pair fell down to 1.1079 before recovering some, consolidating now around the 1.1100 figure, the 50% retracement of the latest weekly slump between 1.1375 and 1.0821. With a light calendar ahead in the US session, currencies will likely trade on sentiment, tracking stocks moves.
From a technical point of view, the 1 hour chart shows that the technical indicators have erased their extreme overbought readings and turned flat within neutral territory. In the same chart, the price stands below a bearish 20 SMA, but well above the 100 and 200 SMAs, the shortest around 1.1030. In the 4 hours chart the price is far above a bullish 20 SMA, whilst the technical indicators keep correcting lower from overbought levels, but within positive territory, indicating the downward correction may extend on a break below the mentioned daily low.
Support levels: 1.1080 1.1050 1.1010
Resistance levels: 1.1120 1.1160 1.1200
GBP/USD Current price: 1.4292
View Live Chart for the GBP/USD
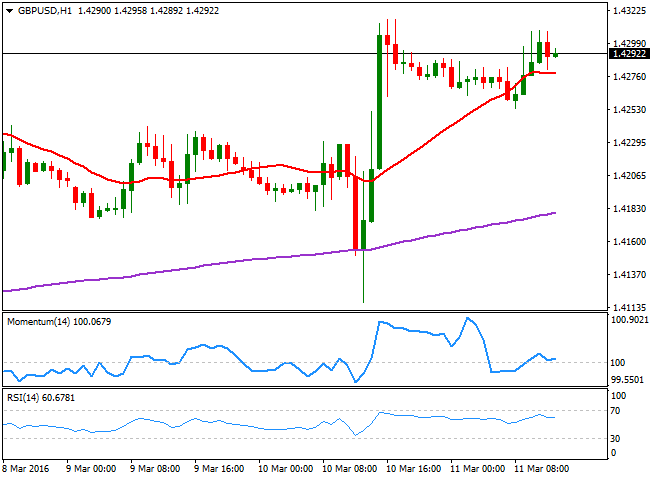
The GBP/USD pair hovers around the 1.4300 figure, little changed after the release of UK data, showing that the trade balance deficit came in better-than-expected, at £-10.29B, against £-10.3B in January. Consumer inflation expectations however, showed that the expected inflation is now 1.8% against previous 2.0% for this year. The pair trades uneventfully in the short term, although given that the price remains near its weekly highs, the risk remains towards the upside. In the 1 hour chart, the price is above its 20 SMA, while the technical indicators have turned lower above their mid-lines, reflecting the ongoing lack of interest surrounding the pair. In the 4 hours chart, dips have met buying interest around the 200 EMA, around 1.4260, and the immediate support, while the technical indicators also turned south within positive territory. At this point the pair needs to extend beyond 1.4335 to be able to continue rallying up to the 1.4410 region.
Support levels: 1.4260 1.4220 1.4170
Resistance levels: 1.4335 1.4370 1.4410
USD/JPY Current price: 113.70
View Live Chart for the USD/JPY
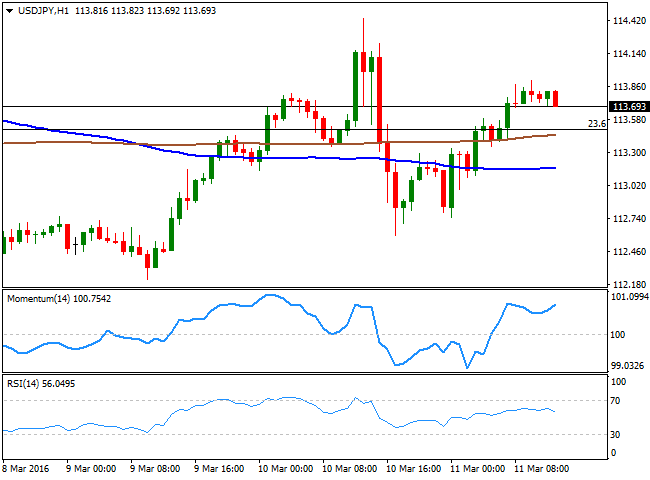
Capped by 114.00, little changed. The USD/JPY pair recovered most of its latest losses during the Asian session, but remains unable to advance beyond the 114.00 figure, in line with the long term dominant bearish trend. The pair has saw a downward knee-jerk towards 112.60 after the ECB, but it quickly bounced, suggesting bearish interest has become to decrease, but needs to be confirmed with further gains beyond the 114.60 level, where it stalled this week. Technically, the 1 hour chart shows that the price is above its moving average and the 113.50 Fibonacci level, the immediate support, as Momentum indicator heads north above its 100 level. In the same chart however, the RSI has turned lower, now around 54 and limiting chances of further gains. In the 4 hours chart, the technical indicators present tepid bullish slopes within bullish territory, supporting some short term rallies, but lacking enough momentum to confirm a breakout higher.
Support levels: 113.50 113.10 112.70
Resistance levels: 114.00 114.60 115.05
AUD/USD Current price: 0.7514
View Live Chart for the AUD/USD
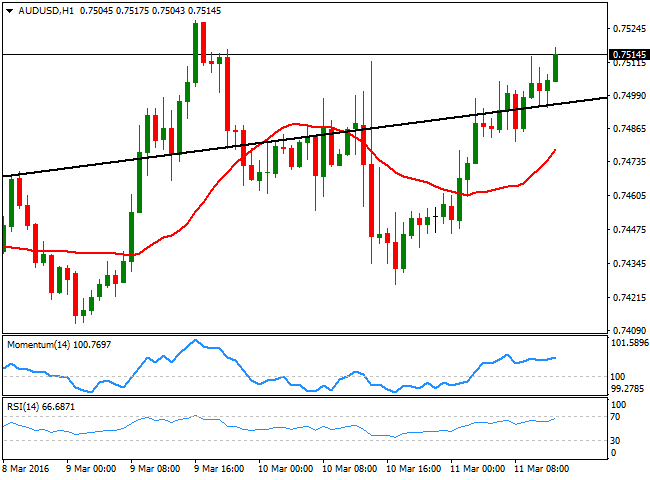
The Australian dollar recovered quickly above the 0.7500 level against the greenback, with market still buying the dips and betting for higher highs. The pair has been stuck around the roof of a daily ascendant channel for most of this week, pressuring to break higher but still unable to confirm an upward acceleration in the longer run. Short term, the bullish stance prevails as in the 1 hour chart, the price is developing above a bullish 20 SMA as the technical indicators resume their advances near overbought territory. In the 4 hours chart, the 20 SMA maintains a strong bullish slope, although the technical indicators lack strength, despite still heading higher within bullish territory.
Support levels: 0.7500 0.7465 0.7420
Resistance levels: 0.7545 0.7580 0.7630
Information on these pages contains forward-looking statements that involve risks and uncertainties. Markets and instruments profiled on this page are for informational purposes only and should not in any way come across as a recommendation to buy or sell in these assets. You should do your own thorough research before making any investment decisions. FXStreet does not in any way guarantee that this information is free from mistakes, errors, or material misstatements. It also does not guarantee that this information is of a timely nature. Investing in Open Markets involves a great deal of risk, including the loss of all or a portion of your investment, as well as emotional distress. All risks, losses and costs associated with investing, including total loss of principal, are your responsibility. The views and opinions expressed in this article are those of the authors and do not necessarily reflect the official policy or position of FXStreet nor its advertisers. The author will not be held responsible for information that is found at the end of links posted on this page.
If not otherwise explicitly mentioned in the body of the article, at the time of writing, the author has no position in any stock mentioned in this article and no business relationship with any company mentioned. The author has not received compensation for writing this article, other than from FXStreet.
FXStreet and the author do not provide personalized recommendations. The author makes no representations as to the accuracy, completeness, or suitability of this information. FXStreet and the author will not be liable for any errors, omissions or any losses, injuries or damages arising from this information and its display or use. Errors and omissions excepted.
The author and FXStreet are not registered investment advisors and nothing in this article is intended to be investment advice.
Recommended Content
Editors’ Picks
US economy grows at an annual rate of 1.6% in Q1 – LIVE

The US' real GDP expanded at an annual rate of 1.6% in the first quarter, the US Bureau of Economic Analysis' first estimate showed on Thursday. This reading came in worse than the market expectation for a growth of 2.5%.
EUR/USD retreats to 1.0700 after US GDP data

EUR/USD came under modest bearish pressure and retreated to the 1.0700 area. Although the US data showed that the economy grew at a softer pace than expected in Q1, strong inflation-related details provided a boost to the USD.
GBP/USD declines below 1.2500 with first reaction to US data

GBP/USD declined below 1.2500 and erased a portion of its daily gains with the immediate reaction to the US GDP report. The US economy expanded at a softer pace than expected in Q1 but the price deflator jumped to 3.4% from 1.8%.
Gold falls below $2,330 as US yields push higher

Gold came under modest bearish pressure and declined below $2,330. The benchmark 10-year US Treasury bond yield is up more than 1% on the day after US GDP report, making it difficult for XAU/USD to extend its daily recovery.
XRP extends its decline, crypto experts comment on Ripple stablecoin and benefits for XRP Ledger

Ripple extends decline to $0.52 on Thursday, wipes out weekly gains. Crypto expert asks Ripple CTO how the stablecoin will benefit the XRP Ledger and native token XRP.


