EUR/USD Current Price: 1.0998
View Live Chart for the EUR/USD
Trading was for the most choppy across the forex board this Tuesday, with the EUR/USD pair ending the day pretty much flat, a few pips below the 1.1000 figure. Risk aversion, triggered by China at the beginning of the day, was the main market mover, as exports fell by 20.6% in Yuan terms and compared to a year before, while imports contracted 8.0% in February, resulting in a 210.0B surplus against the 329.0B expected and the 406.2 previous. In Europe, news were for once positive, as Germany offered some robust manufacturing data, up by 3.3% monthly basis last January, while the EU GDP in the last quarter of 2015, grew by 0.3%, in line with market's expectations.
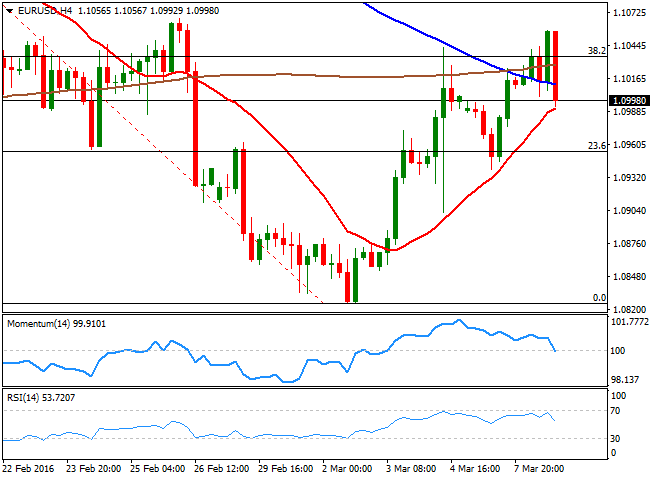
Concerns over what the ECB may deliver next Thursday is also helping keep the EUR subdued, as speculation mounts on Mario Draghi delivering more than a 10-15bp deposit rate cut. The broad dollar's weakness keeps the EUR/USD pair near its 2-week high, but from a technical point of view, the bullish potential has decreased due to the lack of follow through. Short term, the 1 hour chart offers a neutral stance, with the price now extending below a horizontal 20 SMA, and the technical indicators mostly flat around their mid-lines. In the 4 hours chart, the technical indicators have turned sharply lower, and the Momentum indicator is about to cross its 100 level towards the downside. The 20 SMA however, keeps heading higher around 1.0980, providing an immediate short term support. If this last gives up, the decline can extend down to the 1.0900/20 region, with scope to test 1.0840, before strong buying interest surges.
Support levels: 1.0980 1.0950 1.0920
Resistance levels: 1.1045 1.1080 1.1120
EUR/JPY Current price: 123.92
View Live Chart for the EUR/JPY
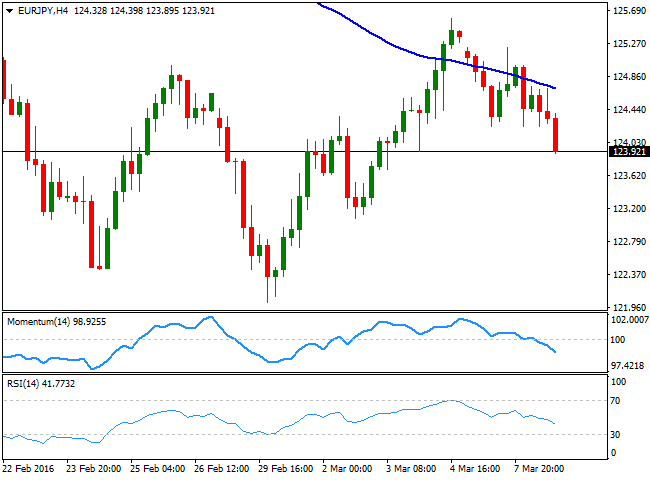
The EUR/JPY pair resumed its decline, as the Japanese currency got favored by the risk-averse environment, with the pair accelerating below the 124.00 level ahead of the US close. Weakening stocks have favored the JPY, while the lack of momentum in the EUR did the rest. The pair trades near a fresh daily low in the 123.80 region, and the 1 hour chart shows that its back below its 100 and 200 SMAs, whilst the technical indicators failed to overcome their mid-lines before turning sharply lower, favoring additional declines for the upcoming Asian session. In the 4 hours chart, the price was rejected from a bearish 100 SMA, whilst the technical indicators have accelerated their declines after breaking below their mid-lines, also in line with further slides.
Support levels: 123.65 123.20 122.80
Resistance levels: 124.40 124.90 125.30
GBP/USD Current price: 1.4203
View Live Chart for the GBP/USD
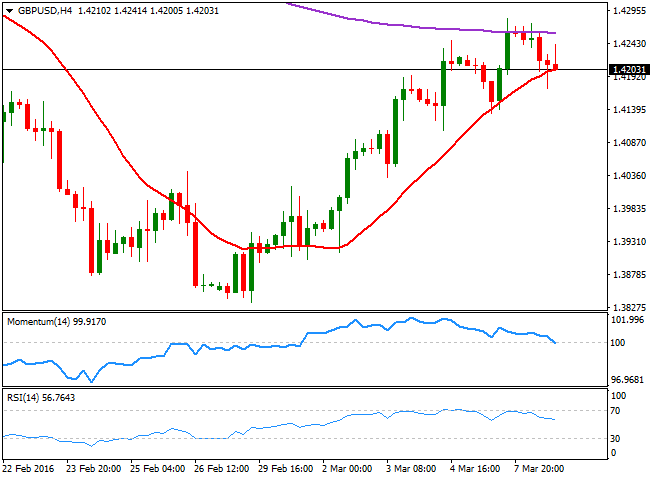
The British Pound traded heavier, easing almost a full cent against the greenback after briefly pocking through 1.4280 late Monday. Increasing risk aversion and poor performance of commodities' prices weighed on the Sterling, as no data was released in the UK. On Wednesday however, the country will release its latest manufacturing and industrial production data, which will offer more clues on the health of the kingdom. Comments from BOE's Governor Mark Carney before the Parliament, favoring remaining within the EU did little for the local currency. The pair fell down to 1.4172, and currently struggles around the 1.4200 level, with intraday charts favoring a continued decline for the Asian session, as in the 1 hour chart, the price is being capped since early Europe by a bearish 20 SMA, while the technical indicators turned south below their mid-lines. In the 4 hours chart, the Momentum indicator is crossing its 100 line with a sharp bearish slope, while the price keeps pressuring a still bullish 20 SMA, suggesting a break below the mentioned low should lead to a continued decline this Wednesday.
Support levels: 1.4165 1.4120 1.4070
Resistance levels: 1.4230 1.4260 1.4290
USD/JPY Current price: 113.04
View Live Chart for the USD/JPY
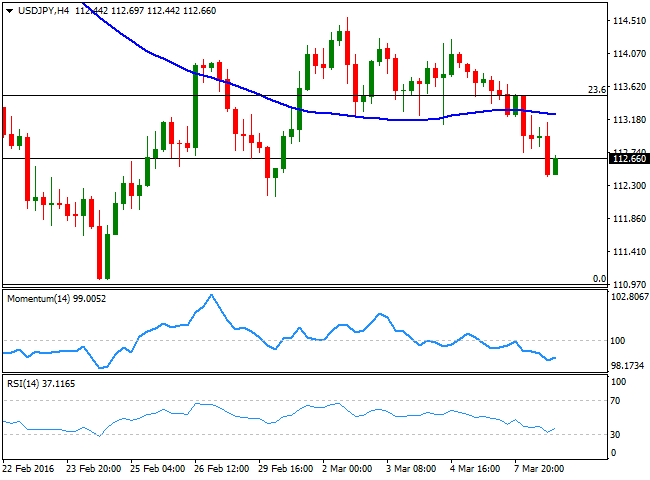
The Japanese yen outperformed its major rivals, advancing against all of its major rivals. The USD/JPY pair fell during the Asian session, as adding to increasing risk aversion, Japanese GDP resulted better-than-expected, contracting 0.3% in the last quarter of 2015, against market's forecast and first estimate of a 0.4% decline. The pair set a daily low of 112.41, and trades a handful of pips above it ahead of the Asian opening, retaining the bearish bias seen on previous updates. Technically, the 1 hour chart shows that the price has extended its slide well below its 100 and 200 SMAs, whilst the shortest has accelerated its decline above the largest, reflecting a strong downward momentum. The technical indicators in the mentioned time frame diverge from each other, with the RSI indicator bouncing from oversold levels, rather tracking the latest bounce than suggesting further recoveries. In the 4 hours chart, the technical indicators are giving limited signs of downward exhaustion near oversold territory, far from supporting an upcoming upward move. Should the decline extend below 112.15, the immediate support, the pair is poised to retest the 111.00 region later on the day.
Support levels: 112.15 111.60 111.20
Resistance levels: 112.70 113.20 113.50
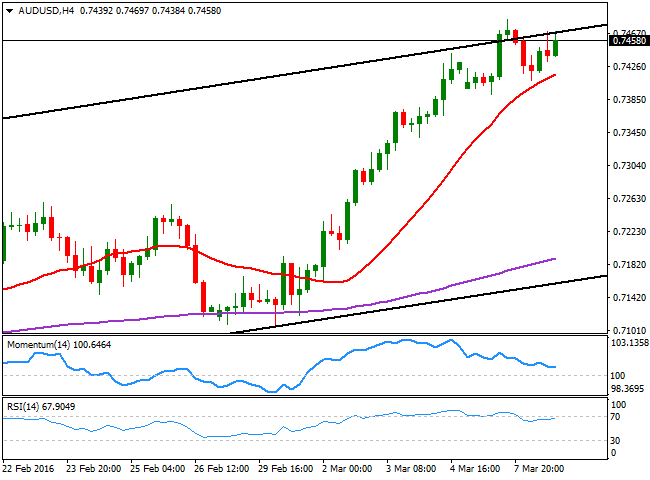
AUD/USD Current price: 0.7465
View Live Chart for the AUD/USD
The Australian dollar refused to give up this Tuesday, and despite falling down to 0.7490 against the greenback, it managed to trim its daily losses and surge back towards the roof of the ascendant channel, briefly overcome on Monday. Holding at its highest since last July, the Aussie is now being supported by speculative buying interest, and the rally may well continue in spite of bad news. The technical picture shows that the pair has been unable to extend beyond 0.7470 during the last trading sessions, have retreated twice from the level, which stands for the roof of the mentioned ascendant channel in the 1 hour chart. But the price is firm above a flat 20 SMA while the technical indicators head higher within bullish territory in the same time frame. In the 4 hours chart, the price has bounced from a strongly bullish 20 SMA, while the RSI indicator resumed its advance near overbought levels, whilst the Momentum indicator is turning flat above the 100 level, after correcting overbought conditions, all of which maintains the risk towards the upside, particularly on a break above 0.7484, this week high.
Support levels: 0.74350.7400 0.7365
Resistance levels: 0.7490 0.7530 0.7585
Information on these pages contains forward-looking statements that involve risks and uncertainties. Markets and instruments profiled on this page are for informational purposes only and should not in any way come across as a recommendation to buy or sell in these assets. You should do your own thorough research before making any investment decisions. FXStreet does not in any way guarantee that this information is free from mistakes, errors, or material misstatements. It also does not guarantee that this information is of a timely nature. Investing in Open Markets involves a great deal of risk, including the loss of all or a portion of your investment, as well as emotional distress. All risks, losses and costs associated with investing, including total loss of principal, are your responsibility. The views and opinions expressed in this article are those of the authors and do not necessarily reflect the official policy or position of FXStreet nor its advertisers. The author will not be held responsible for information that is found at the end of links posted on this page.
If not otherwise explicitly mentioned in the body of the article, at the time of writing, the author has no position in any stock mentioned in this article and no business relationship with any company mentioned. The author has not received compensation for writing this article, other than from FXStreet.
FXStreet and the author do not provide personalized recommendations. The author makes no representations as to the accuracy, completeness, or suitability of this information. FXStreet and the author will not be liable for any errors, omissions or any losses, injuries or damages arising from this information and its display or use. Errors and omissions excepted.
The author and FXStreet are not registered investment advisors and nothing in this article is intended to be investment advice.
Recommended Content
Editors’ Picks
AUD/USD stands firm above 0.6500 with markets bracing for Aussie PPI, US inflation

The Aussie Dollar begins Friday’s Asian session on the right foot against the Greenback after posting gains of 0.33% on Thursday. The AUD/USD advance was sponsored by a United States report showing the economy is growing below estimates while inflation picked up. The pair traded at 0.6518.
EUR/USD mired near 1.0730 after choppy Thursday market session

EUR/USD whipsawed somewhat on Thursday, and the pair is heading into Friday's early session near 1.0730 after a back-and-forth session and complicated US data that vexed rate cut hopes.
Gold soars as US economic woes and inflation fears grip investors

Gold prices advanced modestly during Thursday’s North American session, gaining more than 0.5% following the release of crucial economic data from the United States. GDP figures for the first quarter of 2024 missed estimates, increasing speculation that the US Fed could lower borrowing costs.
Ethereum could remain inside key range as Consensys sues SEC over ETH security status

Ethereum appears to have returned to its consolidating move on Thursday, canceling rally expectations. This comes after Consensys filed a lawsuit against the US SEC and insider sources informing Reuters of the unlikelihood of a spot ETH ETF approval in May.
Bank of Japan expected to keep interest rates on hold after landmark hike

The Bank of Japan is set to leave its short-term rate target unchanged in the range between 0% and 0.1% on Friday, following the conclusion of its two-day monetary policy review meeting for April. The BoJ will announce its decision on Friday at around 3:00 GMT.
