EUR/USD Current Price: 1.1085
View Live Chart for the EUR/USD
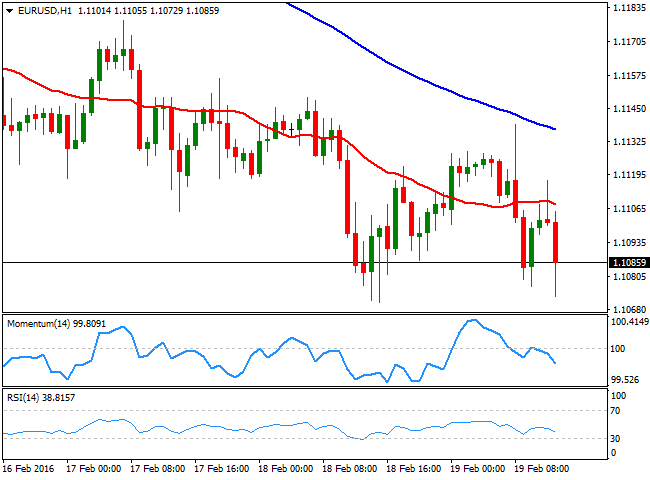
The dollar traded slightly higher after the European opening, but sentiment continued seesawing within appetite and aversion, with no certain winner during the first half of the day. Asian shares plummeted, dragging down European equities, although the decline in these last has been so far moderated. Early data released in Europe showed that in Germany, the index of producer prices for industrial products fell by 2.4% compared with the corresponding month of the preceding year, and by 0.7% compared to December 2015. Anyway, investors held their breath ahead of the release of the US inflation figures for January, which resulted better than expected, triggering a round of dollar's buying. Core inflation yearly basis rose 2.2%, above market's expectations of 2.1%, while monthly basis, it advanced 0.3%.
The EUR/USD extended its decline towards its weekly low, and seems ready to continue falling, given that in the 1 hour chart, the technical indicators are gaining bearish strength within negative territory, as the price develops below its 20 SMA. In the 4 hours chart, the bearish tone is even more clear, with the pair also being capped by a bearish 20 SMA and the technical indicators accelerating their declines towards their mid-lines.
Support levels: 1.1045 1.1000 1.0960
Resistance levels: 1.1120 1.1160 1.1200
GBP/USD Current price: 1.4253
View Live Chart for the GBP/USD
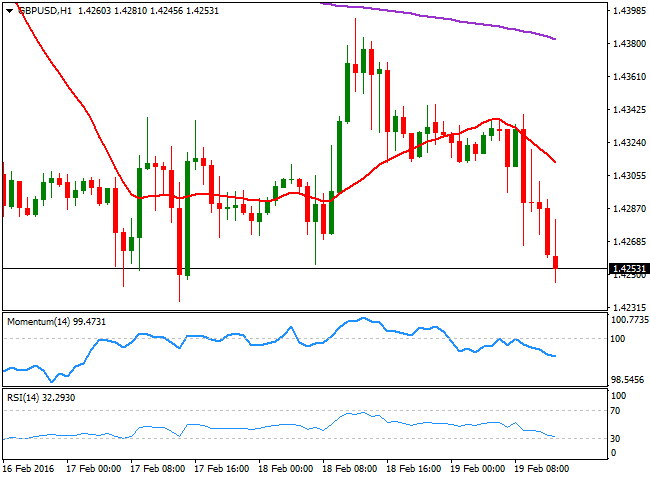
The GBP/USD pair plummeted in spite of positive UK data. According to official data retail sales in January surged by 5.2% compared to a year before, and 2.3% monthly basis. Previous month readings suffered downward revisions, probably the main reason why the pair was unable to rally. Following the release of US inflation figures, the pair fell to a fresh daily low, and the 1 hour chart shows that the 20 SMA has turned sharply lower well above the current level, while the technical indicators maintain sharp bearish slopes within negative territory, supporting further declines for today. In the 4 hours chart, the 20 SMA continues leading the way lower, attracting sellers on approaches to it, while the Momentum indicator hovers around its mid-line, lacking clear directional strength, and the RSI indicator heads lower around 36. A break below 1.4234, the weekly low, should see the pair extending towards the 1.4100 region, should dollar's strength prevails.
Support levels: 1.4234 1.4190 1.4155
Resistance levels: 1.4290 1.4330 1.4370
USD/JPY Current price: 113.15
View Live Chart for the USD/JPY
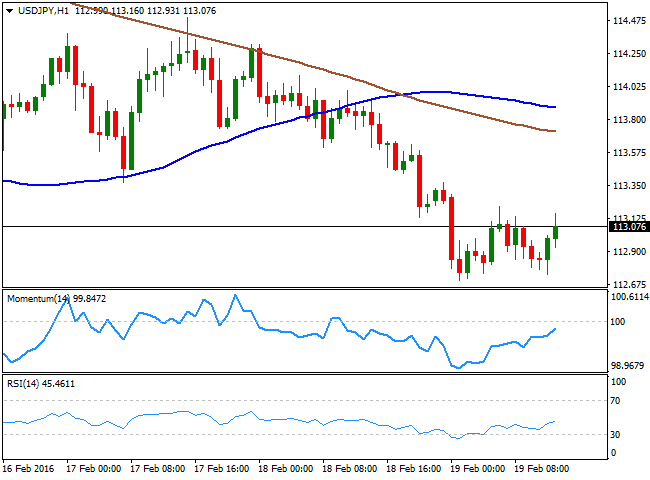
Limited upward potential. The USD/JPY fell down to 112.70 at the beginning of the day, with the yen strengthening amid resurging risk aversion. The pair hovered around the 113.00 for most of the European morning, and positive US inflation data is doing little for the pair, given that it barely advance 20 pips after the release of strong figures. The pair may advance further, but there are no technical signs that the movement will be firm, given that in the 1 hour chart, the price remains well below its moving averages, while the technical indicators aim higher, but still below their mid-lines. In the 4 hours chart, the technical indicators also aim higher below their mid-lines, but the price is still far below their mid-lines. The pair needs at least to advance beyond 113.70, to have a more constructive outlook at least in the short term.
Support levels: 112.90 112.50 112.10
Resistance levels: 113.35 113.70 114.00
AUD/USD Current price: 0.7089
View Live Chart for the AUD/USD
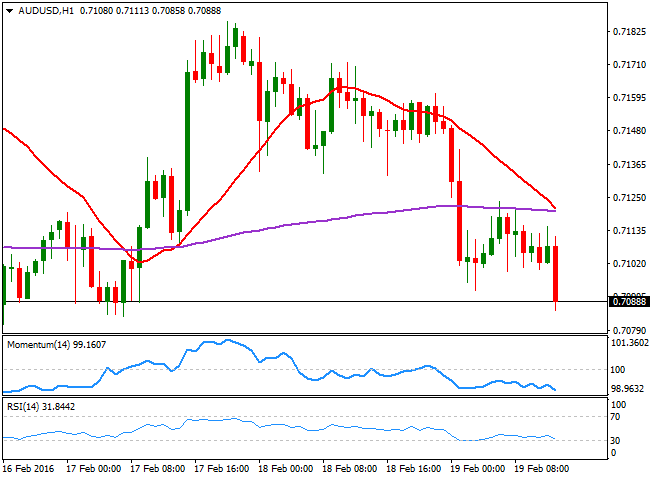
The AUD/USD pair is pressuring its weekly low around the 0.7080 region, as broad dollar's strength weighs. The risk is towards the downside, with the 20 SMA heading south well above their mid-lines, whilst the technical indicators have turned south near oversold levels. In the 4 hours chart, the technical indicators head south slightly below their mid-lines, as the price battles to extend below its 200 EMA, which may open doors for a sharper decline during the upcoming week.
Support levels: 0.7070 0.7025 0.6980
Resistance levels: 0.7110 0.7145 0.7190
Information on these pages contains forward-looking statements that involve risks and uncertainties. Markets and instruments profiled on this page are for informational purposes only and should not in any way come across as a recommendation to buy or sell in these assets. You should do your own thorough research before making any investment decisions. FXStreet does not in any way guarantee that this information is free from mistakes, errors, or material misstatements. It also does not guarantee that this information is of a timely nature. Investing in Open Markets involves a great deal of risk, including the loss of all or a portion of your investment, as well as emotional distress. All risks, losses and costs associated with investing, including total loss of principal, are your responsibility. The views and opinions expressed in this article are those of the authors and do not necessarily reflect the official policy or position of FXStreet nor its advertisers. The author will not be held responsible for information that is found at the end of links posted on this page.
If not otherwise explicitly mentioned in the body of the article, at the time of writing, the author has no position in any stock mentioned in this article and no business relationship with any company mentioned. The author has not received compensation for writing this article, other than from FXStreet.
FXStreet and the author do not provide personalized recommendations. The author makes no representations as to the accuracy, completeness, or suitability of this information. FXStreet and the author will not be liable for any errors, omissions or any losses, injuries or damages arising from this information and its display or use. Errors and omissions excepted.
The author and FXStreet are not registered investment advisors and nothing in this article is intended to be investment advice.
Recommended Content
Editors’ Picks
EUR/USD clings to daily gains above 1.0650

EUR/USD gained traction and turned positive on the day above 1.0650. The improvement seen in risk mood following the earlier flight to safety weighs on the US Dollar ahead of the weekend and helps the pair push higher.
GBP/USD recovers toward 1.2450 after UK Retail Sales data

GBP/USD reversed its direction and advanced to the 1.2450 area after touching a fresh multi-month low below 1.2400 in the Asian session. The positive shift seen in risk mood on easing fears over a deepening Iran-Israel conflict supports the pair.
Gold holds steady at around $2,380 following earlier spike

Gold stabilized near $2,380 after spiking above $2,400 with the immediate reaction to reports of Israel striking Iran. Meanwhile, the pullback seen in the US Treasury bond yields helps XAU/USD hold its ground.
Bitcoin Weekly Forecast: BTC post-halving rally could be partially priced in Premium

Bitcoin price shows no signs of directional bias while it holds above $60,000. The fourth BTC halving is partially priced in, according to Deutsche Bank’s research.
Week ahead – US GDP and BoJ decision on top of next week’s agenda

US GDP, core PCE and PMIs the next tests for the Dollar. Investors await BoJ for guidance about next rate hike. EU and UK PMIs, as well as Australian CPIs also on tap.


