EUR/USD Current Price: 1.1233
View Live Chart for the EUR/USD
The American dollar posted a tepid recovery during the first half of the day, advancing against most of its major rivals amid easing risk aversion. European stocks opened higher and stood in the green, although with limited gains, whilst oil prices consolidate above $27.00 a barrel after bottoming near $26.00 during the previous American session. In Europe, news were mixed, as the EU and Germany GDPs showed that both grew by 0.3% during the last quarter of 2015, matching expectations. In Germany, inflation grew by 0.5% during January this year, in line with market's expectations, but negative news come from the EU industrial sector, as Industrial Production during December plummeted 1.0% monthly basis, leaving the year-on-year reading at minus 1.3% during the same month. Dollar's advance continued until the release of US data, showing that Retail Sales in January advanced more than expected, up 0.2% higher monthly basis and by 0.1% compared to a year before. Despite positive, data was for the most tepid, albeit enough to push the dollar even higher.
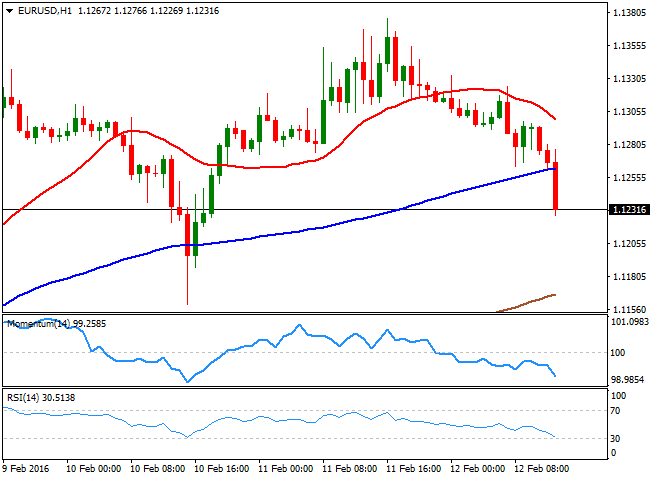
The EUR/USD pair trades at a fresh 2-day low, and the hourly chart shows that the decline is extending below the 100 SMA, while the 20 SMA has turned strongly lower in the 1.1300 region, and the technical indicators head south within bearish territory, supporting some additional declines, should market's mood remain positive. In the 4 hours chart, the current candle is extending below its 20 SMA, while the technical indicators head lower below their mid-lines, in line with the shorter term outlook. Below 1.1200, the decline can accelerate on profit taking, and see the pair down to 1.1120 by the end of the day.
Support levels: 1.1200 1.1160 1.1120
Resistance levels: 1.1245 1.1290 1.1335
GBP/USD Current price: 1.4487
View Live Chart for the GBP/USD
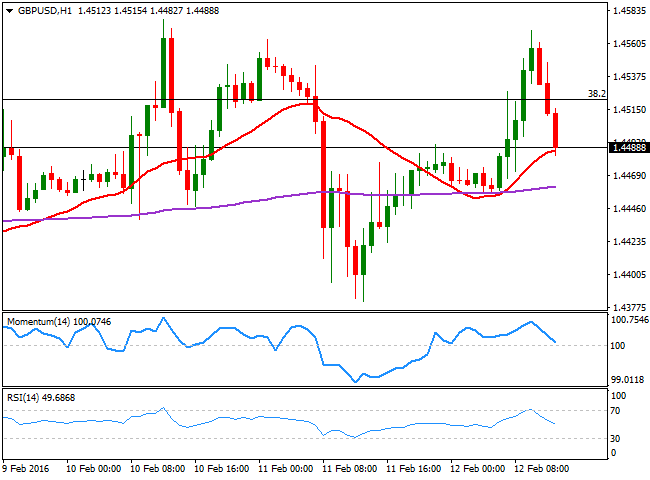
The GBP/USD pair advanced up to 1.4569 during the European morning, as risk aversion eased, but retreated from the level towards the 1.4500 region ahead of the release of US data. The short term decline extended after better-than-expected US macroeconomic figures, and the pair is gaining short term bearish strength, as in the 1 hour chart, the price is pressuring its 20 SMA, while the technical indicators have turned sharply lower, and are about to cross their mid-lines towards the downside. In the 4 hours chart, the technical picture is neutral, with the indicators turning lower around their mid-lines, and the price a few pips above a mild bullish 20 SMA. Should the price break below 1.4450, the immediate support, further declines could be seen, down to the 1.4350 region, a strong Fibonacci support and this week low.
Support levels: 1.4450 1.4400 1.14350
Resistance levels: 1.4535 1.4560 1.4600
USD/JPY Current price: 113.10
View Live Chart for the USD/JPY
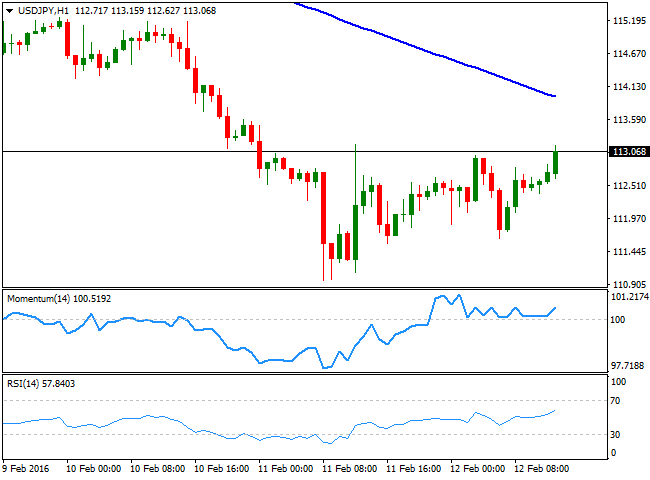
Trying to regain 113.00. The USD/JPY pair remained capped below the 113.00 for most of this Friday, having advanced up to a daily high of 113.01 before retreating. The pair traded within yesterday's range, without much directional conviction. The US Retail Sales beating expectations however, helped the pair to advance to fresh daily highs near 113.20, albeit so far the advance seems quite limited. Technically, the 1 hour chart shows that the 100 SMA heads lower around 113.80 the immediate resistance, while the technical indicators accelerated their advances within positive territory. In the 4 hours chart, the technical indicators have corrected extreme oversold readings, but lost upward steam well below their mid-lines, suggesting there's little buying interest around this levels. Should the price continue advancing, and US stocks recover the ground lost earlier this week, the rally can extend up towards the 114.30 region during the American session.
Support levels: 112.60 112.10 111.70
Resistance levels: 113.35 113.80 114.30
AUD/USD Current price: 0.7093
View Live Chart for the AUD/USD
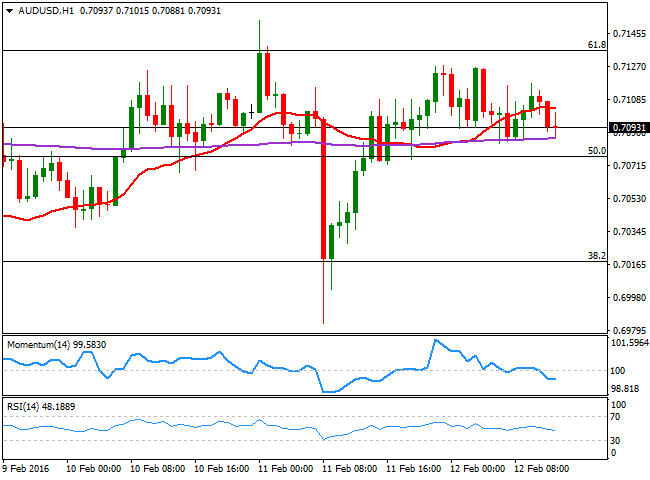
The AUD/USD pair has traded lower in range for most of the day, dominated by dollar's positive tone, but lacking directional strength. US data was unable to affect the pair still ranging below the 0.7100 level, and with the 1 hour chart showing price hovering below a flat 20 SMA. In the same chart, the technical indicators hold within negative territory, but head nowhere, while in the 4 hours chart, the pair is also presenting a neutral stance, with the price a few pips above its 20 SMA and the technical indicators heading south above their mid-lines. A downward acceleration below 0.7070, a Fibonacci support, should favor a continued decline down to 0.6980,where the pair bounced several times during the last few days.
Support levels: 0.7070 0.7030 0.6980
Resistance levels: 0.7135 0.7170 0.7210
Information on these pages contains forward-looking statements that involve risks and uncertainties. Markets and instruments profiled on this page are for informational purposes only and should not in any way come across as a recommendation to buy or sell in these assets. You should do your own thorough research before making any investment decisions. FXStreet does not in any way guarantee that this information is free from mistakes, errors, or material misstatements. It also does not guarantee that this information is of a timely nature. Investing in Open Markets involves a great deal of risk, including the loss of all or a portion of your investment, as well as emotional distress. All risks, losses and costs associated with investing, including total loss of principal, are your responsibility. The views and opinions expressed in this article are those of the authors and do not necessarily reflect the official policy or position of FXStreet nor its advertisers. The author will not be held responsible for information that is found at the end of links posted on this page.
If not otherwise explicitly mentioned in the body of the article, at the time of writing, the author has no position in any stock mentioned in this article and no business relationship with any company mentioned. The author has not received compensation for writing this article, other than from FXStreet.
FXStreet and the author do not provide personalized recommendations. The author makes no representations as to the accuracy, completeness, or suitability of this information. FXStreet and the author will not be liable for any errors, omissions or any losses, injuries or damages arising from this information and its display or use. Errors and omissions excepted.
The author and FXStreet are not registered investment advisors and nothing in this article is intended to be investment advice.
Recommended Content
Editors’ Picks
EUR/USD holds above 1.0650 after US data

EUR/USD retreats from session highs but manages to hold above 1.0650 in the early American session. Upbeat macroeconomic data releases from the US helps the US Dollar find a foothold and limits the pair's upside.
GBP/USD retreats toward 1.2450 on modest USD rebound

GBP/USD edges lower in the second half of the day and trades at around 1.2450. Better-than-expected Jobless Claims and Philadelphia Fed Manufacturing Index data from the US provides a support to the USD and forces the pair to stay on the back foot.
Gold is closely monitoring geopolitics

Gold trades in positive territory above $2,380 on Thursday. Although the benchmark 10-year US Treasury bond yield holds steady following upbeat US data, XAU/USD continues to stretch higher on growing fears over a deepening conflict in the Middle East.
Ripple faces significant correction as former SEC litigator says lawsuit could make it to Supreme Court

Ripple (XRP) price hovers below the key $0.50 level on Thursday after failing at another attempt to break and close above the resistance for the fourth day in a row.
Have we seen the extent of the Fed rate repricing?

Markets have been mostly consolidating recent moves into Thursday. We’ve seen some profit taking on Dollar longs and renewed demand for US equities into the dip. Whether or not this holds up is a completely different story.


