EUR/USD Current Price: 1.1352
View Live Chart for the EUR/USD
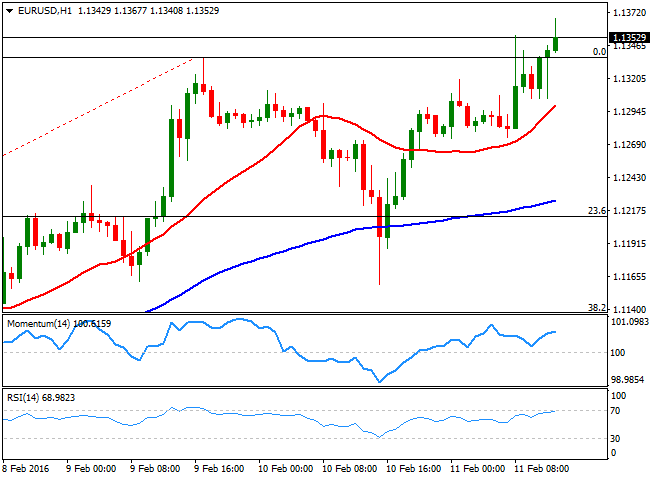
Investors are on their toes this Thursday as risk aversion reaches a new peak, with oil prices nearing $26.00 a barrel, stock plummeting to fresh multi-month lows and safe-haven assets running. The EUR/USD pair trades at fresh highs in the 1.1350 region, as the dollar resumes its decline ahead of the US opening bell. There were no macroeconomic releases in Europe, but local bond yields got out of control, with UK bond yields at record lows and German ones at 0.16%, the lowest since April 2015, as investors demand safety. The panic rallies are also affecting US stocks, with the DJIA down over 250 points ahead of the opening.
As for the EUR/USD pair holds near its high of 1.3567, having broke above previous highs in the 1.1335 region, now the immediate short term support. Technically, the 1 hour chart supports some further advances, as the 20 SMA continued to provided an intraday support on retracements, whilst the technical indicators head higher in positive territory. In the 4 hours chart, the technical outlook is also strongly bullish, albeit upcoming moves will clearly be related to market's sentiment rather than any technical sign.
Support levels: 1.1335 1.1290 1.1245
Resistance levels: 1.1385 1.1420 1.1460
GBP/USD Current price: 1.4399
View Live Chart for the GBP/USD
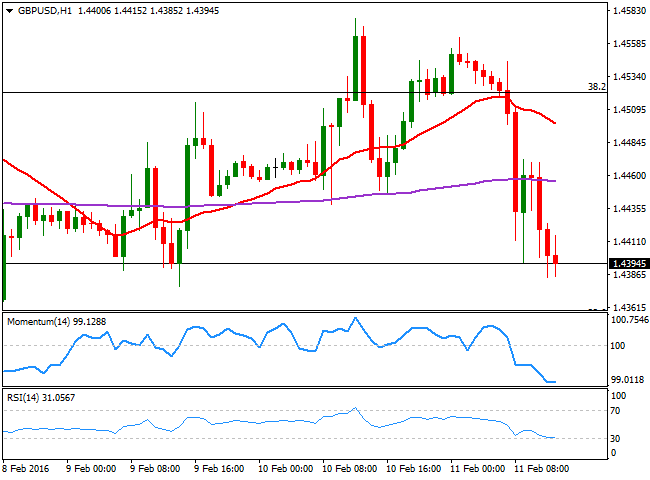
The GBP/USD pair eases below the 1.4400 figure, with dollar enjoying some limited demand against some of its riskier assets counterparts, joining forces with Pound self weakness. The pair has traded as high as 1.4563 during the previous Asian session, but once again failed to establish itself above the key region of 1.4520/30, and quickly turned back south. Short term, the 1 hour chart shows that the technical indicators are losing partially their bearish strength near oversold levels, while the 20 SMA turned strongly lower far above the current level. In the 4 hours chart, the pair is below a bearish 20 SMA, while the technical indicators head south below their mid-lines, all of which supports further declines towards the 1.4350 Fibonacci support, also the weekly low.
Support levels: 1.4350 1.4310 1.4265
Resistance levels: 1.4425 1.4460 1.4525
USD/JPY Current price: 112.37
View Live Chart for the USD/JPY
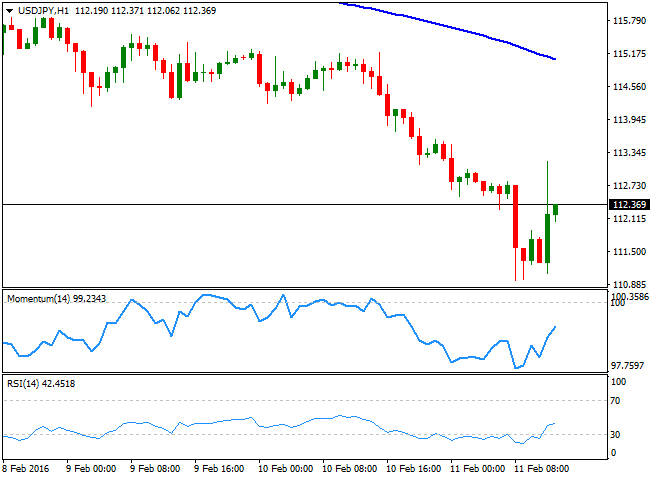
Unstoppable decline crashes with intervention rumors. The USD/JPY fell down to 110.97, its lowest since October 2014. In spite Japan markets were closed on a local holiday, the decline was severe during the Asian session, extending further after the European opening, and drove purely by market sentiment. Mid European morning, the pair bounced to a daily high of 113.17 on some unfounded rumors of a BOJ's intervention, but the pair retreated back. It's a wild ride the one going on in the pair, and any position seems risky at the time being, although the dominant bearish trend remains firm in place and will likely prevails. Anyway, the 1 hour chart shows that the technical indicators have recovered from extreme oversold territory and head higher within bearish territory, while the price remains far below its moving averages. In the 4 hours chart, the technical indicators also bounced back, but remain within oversold territory. Another round of selling below 112.00 should put the pair back in the bearish track, although a retest of the daily low seems unlikely now.
Support levels: 112.00 111.60 111.20
Resistance levels: 112.75 113.20 113.50
AUD/USD Current price: 0.7074
View Live Chart for the AUD/USD
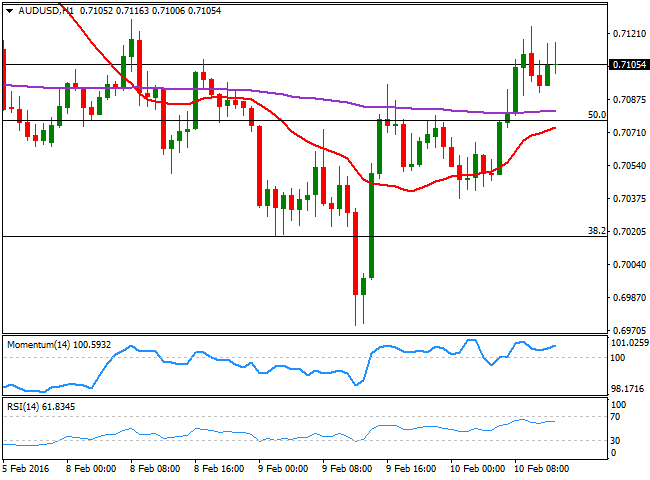
The AUD/USD pair sunk to 0.6983 early Europe as risk aversion turned into panic selling, but the pair staged a nice comeback afterwards, suggesting buying interest on deeps continues to increase, as the price remains near the 0.7100 level, despite the ongoing turmoil in commodities and equities. Technically, the 1 hour chart shows that the price stalled its latest run around a bearish 20 SMA, while the technical indicators are losing upward strength below their mid-lines, limiting chances of a run higher as long as the 0.7090 level holds. In the 4 hours chart, the price hovers around a horizontal 20 SMA, while the technical indicators aim higher around their mid-lines, lacking enough strength to confirm a new leg higher.
Support levels: 0.7050 0.7010 0.6980
Resistance levels: 0.7090 0.7135 0.7170
Information on these pages contains forward-looking statements that involve risks and uncertainties. Markets and instruments profiled on this page are for informational purposes only and should not in any way come across as a recommendation to buy or sell in these assets. You should do your own thorough research before making any investment decisions. FXStreet does not in any way guarantee that this information is free from mistakes, errors, or material misstatements. It also does not guarantee that this information is of a timely nature. Investing in Open Markets involves a great deal of risk, including the loss of all or a portion of your investment, as well as emotional distress. All risks, losses and costs associated with investing, including total loss of principal, are your responsibility. The views and opinions expressed in this article are those of the authors and do not necessarily reflect the official policy or position of FXStreet nor its advertisers. The author will not be held responsible for information that is found at the end of links posted on this page.
If not otherwise explicitly mentioned in the body of the article, at the time of writing, the author has no position in any stock mentioned in this article and no business relationship with any company mentioned. The author has not received compensation for writing this article, other than from FXStreet.
FXStreet and the author do not provide personalized recommendations. The author makes no representations as to the accuracy, completeness, or suitability of this information. FXStreet and the author will not be liable for any errors, omissions or any losses, injuries or damages arising from this information and its display or use. Errors and omissions excepted.
The author and FXStreet are not registered investment advisors and nothing in this article is intended to be investment advice.
Recommended Content
Editors’ Picks
EUR/USD holds gains above 1.0700, as key US data loom

EUR/USD holds gains above 1.0700 in the European session on Thursday. Renewed US Dollar weakness offsets the risk-off market environment, supporting the pair ahead of the key US GDP and PCE inflation data.
GBP/USD extends recovery above 1.2500, awaits US GDP data

GBP/USD is catching a fresh bid wave, rising above 1.2500 in European trading on Thursday. The US Dollar resumes its corrective downside, as traders resort to repositioning ahead of the high-impact US advance GDP data for the first quarter.
Gold price edges higher amid weaker USD and softer risk tone, focus remains on US GDP

Gold price (XAU/USD) attracts some dip-buying in the vicinity of the $2,300 mark on Thursday and for now, seems to have snapped a three-day losing streak, though the upside potential seems limited.
XRP extends its decline, crypto experts comment on Ripple stablecoin and benefits for XRP Ledger

Ripple extends decline to $0.52 on Thursday, wipes out weekly gains. Crypto expert asks Ripple CTO how the stablecoin will benefit the XRP Ledger and native token XRP.
US Q1 GDP Preview: Economic growth set to remain firm in, albeit easing from Q4

The United States Gross Domestic Product (GDP) is seen expanding at an annualized rate of 2.5% in Q1. The current resilience of the US economy bolsters the case for a soft landing.


