EUR/USD Current Price: 1.1202
View Live Chart for the EUR/USD
Dollar's sell-off extended this Thursday, with no new catalyst behind it, although further negative US data fueled the decline early US session. The weekly unemployment claims resulted at 285K for the week ending Jan 29, worse than the expected 280K. Unit labor cost improved during the last quarter of 2015, up by 4.5% against expectations of a 3.9% advance, but nonfarm productivity during the same period shrank by 3.0%. Finally, further signs of manufacturing weakness came with the release of Factory Orders for December, down by 2.9% compared to the previous month.
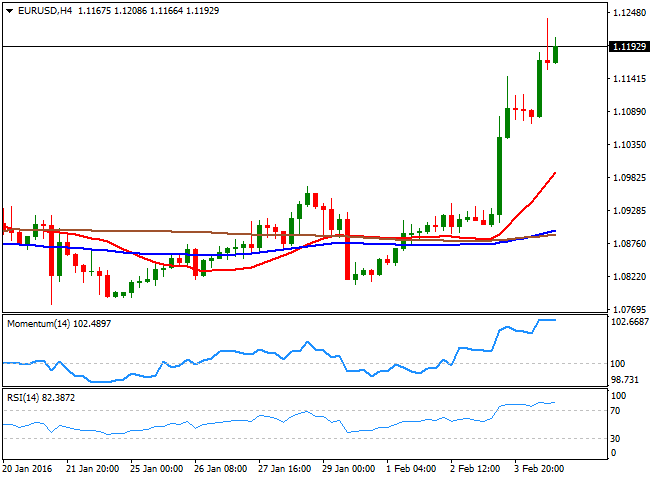
The EUR/USD pair rallied up to 1.1238, a level not seen since October 22nd, and retreated partially towards the 1.1160 region during the US afternoon, meeting there buying interest. Hovering around the 1.1200 region as Wall Street wobbles between gains and losses, the pair has spent most of this last session on the day consolidating gains, as investors moved to wait-and-see mode ahead of the release of the US employment report this Friday. The US economy is expected to have added around 195K new jobs in January, the unemployment rate is expected to remain unchanged at 5%, while wages are expected slightly higher. Anyway, it will take a really strong conjunction of numbers for the releases to give the greenback some support that can be exacerbated by profit taking ahead of the weekend.
In the meantime, the 4 hours chart shows that the technical indicators have lost their upward strength, but consolidate alongside with price, now horizontals near overbought levels. In the same chart, the 20 SMA maintains a sharp upward slope well below the current level, all of which maintains the latest bullish trend alive. Should the price extend beyond 1.1240, and end the week above it, there's room for additional gains up to 1.1460, a major long term resistance during the upcoming week.
Support levels: 1.1160 1.1120 1.1080
Resistance levels: 1.1240 1.1285 1.1320
EUR/JPY Current price: 130.87
View Live Chart for the EUR/JPY
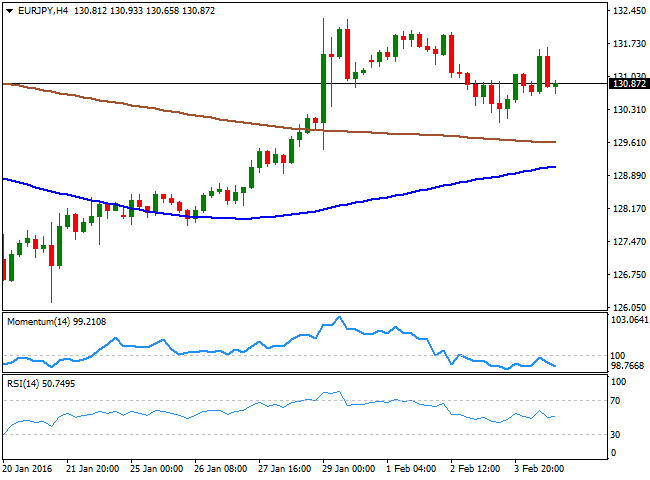
The EUR/JPY advanced at the beginning of the day, but failed to hold in the green as the Japanese yen was broadly higher against all of its major rivals, particularly boosted in the American afternoon by tepid US data, and little progress among US indexes after this week declines. Technically, the 1 hour chart shows that the price is developing between is 100 and 200 SMAs, with the shortest acting as immediate resistance around 131.25 and the largest providing support around 130.20. In the same chart, the technical indicators are turning slightly higher around their mid-lines, but lack enough strength to confirm further advances. In the 4 hours chart, the bias is towards the downside, with the technical indicators heading lower below their mid-lines, but the price still well above the 100 and 200 SMAs.
Support levels: 130.60 130.20 129.80
Resistance levels: 131.25 131.60 132.10
GBP/USD Current price: 1.4589
View Live Chart for the GBP/USD
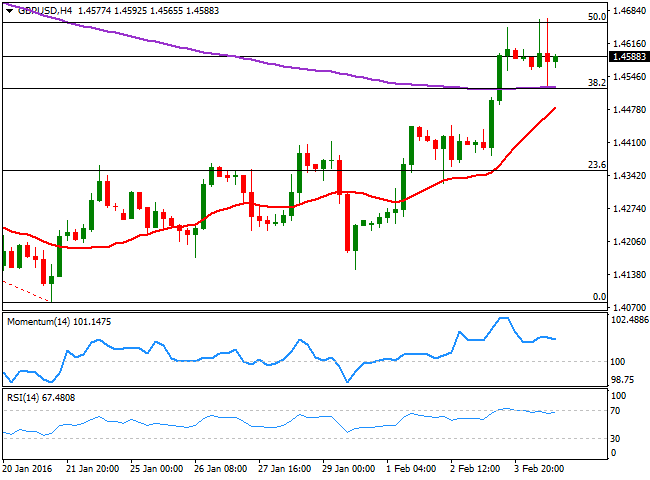
The GBP/USD pair is ending the day pretty much unchanged, as a dovish BOE weighed on Pound. The Central Bank had its economic policy meeting, offering alongside with the latest decision, the quarterly inflation report. All of the MPC members agreed to leave rates unchanged, for the first time since July, with Ian McCafferty, abandoning the hawkish bias. The BOE slashed its growth forecast to 2.2% from previous 2.5%. Governor Carney, said that the next likely move in rates will be up, but a timing is for now, out of the table. Overall, the announcement was no surprise, with the Bank of England joining worldwide partners in their easing bias. The GBP/USD initially fell with the release, posting a daily low of 1.4528, but quickly recovered ground and set a daily high of 1.4667. From a technical point of view, the pair has been contained between Fibonacci levels, finding buyers on an approach to the 38.2% retracement of the latest daily slump, but unable to rally beyond the 50% retracement of the same decline. The pair presents a neutral stance in the short term, as the price is hovering around a horizontal 20 SMA, while the technical indicators have no directional strength, stuck around their mid-lines.
Support levels: 1.4570 1.4530 1.4490
Resistance levels: 1.4625 1.4660 1.4690
USD/JPY Current price: 116.81
View Live Chart for the USD/JPY
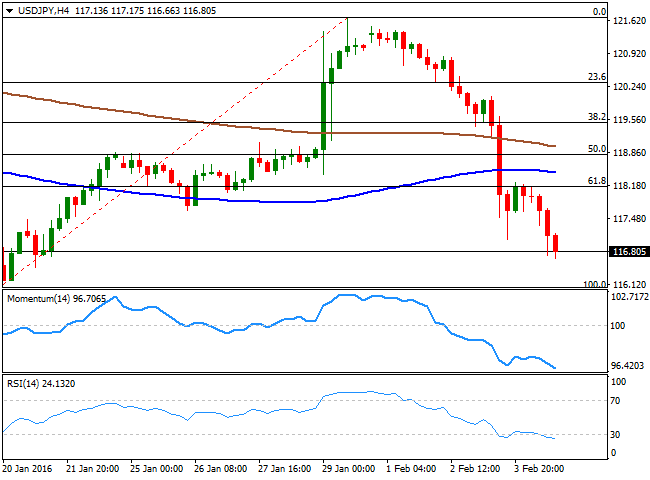
The USD/JPY pair resumed its decline and reached a fresh low of 116.63 during US trading hours, holding nearby as the day comes to an end. The price has been steadily falling ever since failing to recover above the 118.20 level, the 61.8% retracement of the latest bullish run. But it was poor US factory and employment data which pushed the pair further lower and below the 117.00 figure, now the immediate resistance. Technically, the 1 hour chart is showing that the price remains far below the 100 and 200 SMAs, which are slowly turning south well above the current level, while the technical indicators have lost downward strength and turned flat within bearish territory. In the 4 hours chart, the technical indicators maintain strong bearish slopes in oversold territory, currently at fresh lows, while the price is also well below the 100 and 200 SMAs. A weaker-than-expected US employment report can send the pair to retest the low set last January at 115.95, while approaches to the mentioned 118.20 region will probably find selling interest, as the bearish trend will likely prevail.
Support levels: 116.60 116.20 115.95
Resistance levels: 117.00 117.35 117.70
AUD/USD Current price: 0.7216
View Live Chart for the AUD/USD
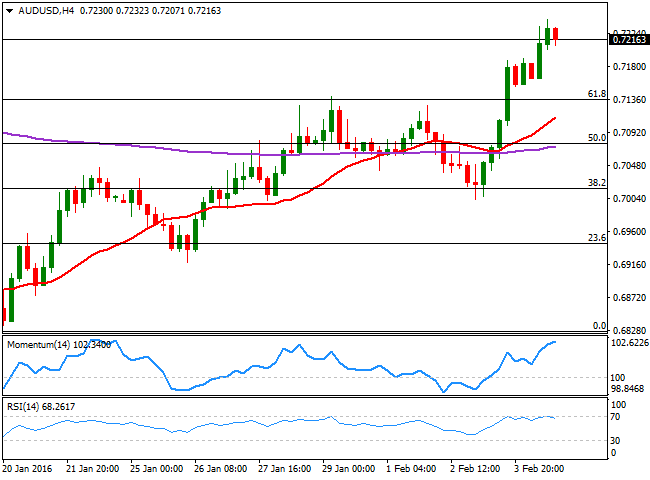
The AUD/USD rallied up to 0.7242 before retracing some, but holding above the 0.7200 figure. The pair got an early boost during the past Asian session, with the Aussie tracking strong employment figures in New Zealand, but also boosted by broad dollar's weakness. During the upcoming Asian session, Australia will release its December Retail Sales data, while the RBA will release the monetary policy statement of its early week meeting. No surprises are expected from this last, as Glenn Steven's speech anticipated most of what the Central Bank thinks. The short term technical picture shows the upward trend is losing momentum, as in the 1 hour chart, the 20 SMA has turned horizontal, currently around 0.7190 while the technical indicators are turning slightly lower, but still well above their mid-lines. In the 4 hours chart, the technical indicators are turning slightly lower near overbought territory, while the 20 SMA presents a bullish slope, well below the current level, around 0.7110.
Support levels: 0.7190 0.7150 0.7110
Resistance levels: 0.7245 0.7290 0.7330
Information on these pages contains forward-looking statements that involve risks and uncertainties. Markets and instruments profiled on this page are for informational purposes only and should not in any way come across as a recommendation to buy or sell in these assets. You should do your own thorough research before making any investment decisions. FXStreet does not in any way guarantee that this information is free from mistakes, errors, or material misstatements. It also does not guarantee that this information is of a timely nature. Investing in Open Markets involves a great deal of risk, including the loss of all or a portion of your investment, as well as emotional distress. All risks, losses and costs associated with investing, including total loss of principal, are your responsibility. The views and opinions expressed in this article are those of the authors and do not necessarily reflect the official policy or position of FXStreet nor its advertisers. The author will not be held responsible for information that is found at the end of links posted on this page.
If not otherwise explicitly mentioned in the body of the article, at the time of writing, the author has no position in any stock mentioned in this article and no business relationship with any company mentioned. The author has not received compensation for writing this article, other than from FXStreet.
FXStreet and the author do not provide personalized recommendations. The author makes no representations as to the accuracy, completeness, or suitability of this information. FXStreet and the author will not be liable for any errors, omissions or any losses, injuries or damages arising from this information and its display or use. Errors and omissions excepted.
The author and FXStreet are not registered investment advisors and nothing in this article is intended to be investment advice.
Recommended Content
Editors’ Picks
AUD/USD favours extra retracements in the short term

AUD/USD kept the negative stance well in place and briefly broke below the key 0.6400 support to clinch a new low for the year on the back of the strong dollar and mixed results from the Chinese docket.
EUR/USD now shifts its attention to 1.0500

The ongoing upward momentum of the Greenback prompted EUR/USD to lose more ground, hitting new lows for 2024 around 1.0600, driven by the significant divergence in monetary policy between the Fed and the ECB.
Gold aiming to re-conquer the $2,400 level

Gold stages a correction on Tuesday and fluctuates in negative territory near $2,370 following Monday's upsurge. The benchmark 10-year US Treasury bond yield continues to push higher above 4.6% and makes it difficult for XAU/USD to gain traction.
Bitcoin price defends $60K as whales hold onto their BTC despite market dip

Bitcoin (BTC) price still has traders and investors at the edge of their seats as it slides further away from its all-time high (ATH) of $73,777. Some call it a shakeout meant to dispel the weak hands, while others see it as a buying opportunity.
Friday's Silver selloff may have actually been great news for silver bulls!

Silver endured a significant selloff last Friday. Was this another step forward in the bull market? This may seem counterintuitive, but GoldMoney founder James Turk thinks it was a positive sign for silver bulls.
