EUR/USD Current Price: 1.1110
View Live Chart for the EUR/USD
The American dollar sold-off this Wednesday, as tepid US data joined forces with technical breakouts in major pairs. The greenback was already under pressure before Wall Street's opening bell, with the EUR and the JPY leading higher, amid poor stocks' performance fueling risk aversion. Mostly, investors were dumping the dollar on increasing worries about the economic slowdown seen late 2015 extending into early 2016. The release of the US services PMI figures fueled the decline, as according to Markit economics, the US services activity growth eased to its weakest for 27 months in January, by printing 53.2. The official figure, the ISM Non-manufacturing PMI for the same month, fell to 53.5 from December's 55.3. The ADP survey showed that the private sector added 205K new jobs in January, beating expectations of 195K, growing at the slowest pace since October. Things are not better in Europe, with weak services PMIs readings and poor EU Retail Sales in December, up just 0.3% in the month. Seems speculators believe they may have rushed to price in the 4 rate hikes promised by the FED, and are quickly unwinding positions.
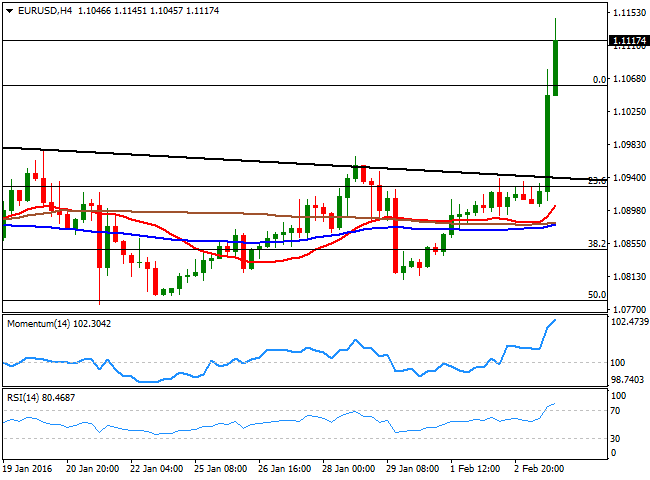
The EUR/USD pair rallied beyond the 1.1100 figure for the first time since past October, and set at 1.1145,having advanced almost 250 pips daily basis, the best EUR performance ever since the December ECB's announcement of a QE extension. The pair has broken beyond its 200 DMA, at 1.1050, now a major support level. In the 4 hours chart, the technical indicators are barely losing upward strength in extreme overbought territory, while the price is far above its moving averages, after the intraday run. The pair has briefly extended beyond a major static resistance around 1.1120, which should contain rallies at least in the short term. Renewed buying interest above it, however, will likely fuel the rally towards the 1.1200 region, the main bullish target for this Thursday.
Support levels: 1.1050 1.1010 1.0970
Resistance levels: 1.1120 1.1160 1.1200
EUR/JPY Current price: 130.45
View Live Chart for the EUR/JPY
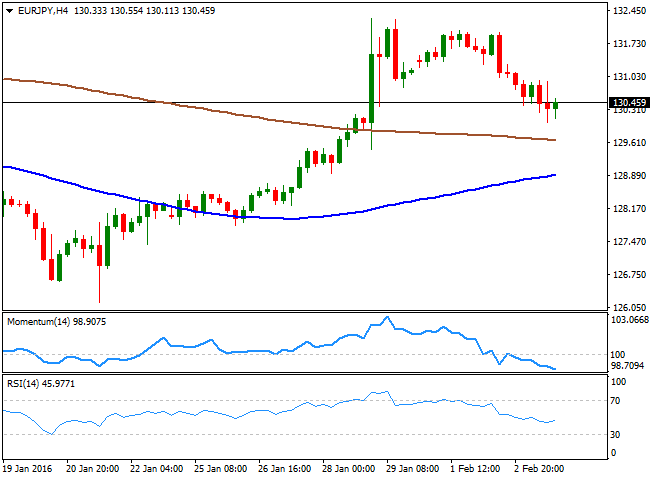
The Japanese yen erased most of its post-BOJ losses against its major rivals, and despite strong EUR demand, the EUR/JPY fell down to 130.03 during the US session. The JPY gained as US stocks plunged this Wednesday, with investors spooked by slowing growth news. Technically the 1 hour chart for the EUR/JPY shows that the price is below its 100 SMA, but stalled above a bullish 200 SMA, currently around 129.80, while the technical indicators aim slightly higher below their mid-lines, lacking directional strength. In the 4 hours chart, however, the technical picture is clearly bearish, as the technical indicators present bearish slopes well below their mid-lines, while the 100 SMA remains far below the 200 SMA.
Support levels: 129.80 129.35 128.80
Resistance levels: 130.40 130.85 131.20
GBP/USD Current price: 1.4603
View Live Chart for the GBP/USD
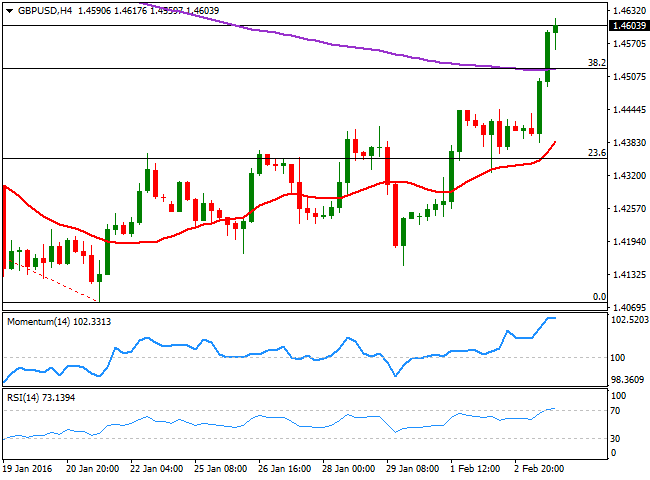
The GBP/USD trades at fresh 4-weeks highs, a handful of pips above the 1.4600 figure. The Pound got an early boost during the European morning, as the Markit services PMI report for January showed that the sector continue to lead the UK recovery, up to 55.6 against the 55.5 previous, and the 55.3 expected. The pair's rally accelerated after breaking above 1.4530, which stands for the 38.2% retracement of the 1.5110/1.4078 decline between December and January. Short term, the 1 hour chart shows that the 20 SMA advanced alongside with the price, but stands well below the current level, while the technical indicators resumed their advances within extreme overbought territory. In the 4 hours chart, the technical indicators are losing upward extreme in overbought territory, the 20 SMA heads higher far below the current level, and the 200 EMA converges with the mentioned Fibonacci level at 1.4530, first time above it since mid December. Retracements down to this last level should be now seen as buying opportunities, while additional gains can be confirmed on a break above 1.4660, the 50% retracement of the mentioned decline.
Support levels: 1.4530 1.4490 1.4450
Resistance levels: 1.4565 1.4600 1.4640
USD/JPY Current price: 117.34
View Live Chart for the USD/JPY
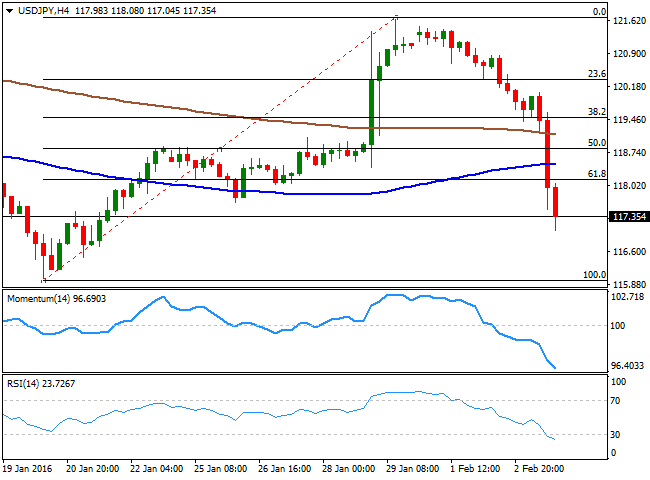
The Japanese yen rally seems unstoppable, with the USD/JPY pair down over 270 pips this Wednesday, and now trading around 117.34, its lowest since January 21st. Risk aversion is supporting yen's strength, but also falling US yields, as 10y ones are at 1.85%, 0.48% lower in the day. The 1 hour chart for the pair shows that the technical indicators maintain strong bearish slopes below their mid-lines, while the price plunged below its 100 and 200 SMAs. It also shows that the price is bouncing from a daily low seta t 117.04, but remains below 117.65, January 26th daily low and the immediate resistance. In the 4 hours chart, the technical indicators maintain their sharp bearish slopes within extreme oversold levels, while the price retraced over 61.8% of its latest daily bullish run between 115.96 and 121.68, pointing for a continued decline towards the low of the range.
Support levels: 117.05 116.60 116.20
Resistance levels: 117.65 117.90 118.40
AUD/USD Current price: 0.7181
View Live Chart for the AUD/USD
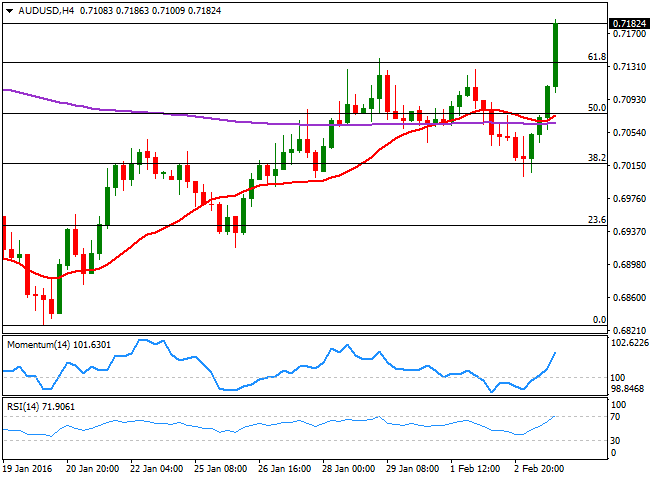
The Australian dollar soared to its highest since early January against the greenback, with the pair trading as high as 0.7186 during the American afternoon. Dollar's sell-off resulted in the pair breaking above the 100 DMA for the first time since January 6th, currently at 0.7156, offering an immediate support. The greenback's decline accelerated earlier in the day, as New York Fed President Bill Dudley said Wednesday that financial conditions have tightened since the Fed raised interest rates in December. The AUD/USD holds near its daily highs, and in the 1 hour chart, the technical indicators are beginning to look exhausted in extreme overbought territory. Nevertheless the pair broke above the 61.8% retracement of its latest daily slump at 0.7145, and as long as the price holds above it, the upside will remain favored. In the 4 hours chart, the technical indicators present a strong upward momentum and are currently approaching overbought levels, while the price has extended well above a now bullish 20 SMA, in line with the shorter term view.
Support levels: 0.7135 0.7100 0.7060
Resistance levels: 0.7200 0.7245 0.7290
Information on these pages contains forward-looking statements that involve risks and uncertainties. Markets and instruments profiled on this page are for informational purposes only and should not in any way come across as a recommendation to buy or sell in these assets. You should do your own thorough research before making any investment decisions. FXStreet does not in any way guarantee that this information is free from mistakes, errors, or material misstatements. It also does not guarantee that this information is of a timely nature. Investing in Open Markets involves a great deal of risk, including the loss of all or a portion of your investment, as well as emotional distress. All risks, losses and costs associated with investing, including total loss of principal, are your responsibility. The views and opinions expressed in this article are those of the authors and do not necessarily reflect the official policy or position of FXStreet nor its advertisers. The author will not be held responsible for information that is found at the end of links posted on this page.
If not otherwise explicitly mentioned in the body of the article, at the time of writing, the author has no position in any stock mentioned in this article and no business relationship with any company mentioned. The author has not received compensation for writing this article, other than from FXStreet.
FXStreet and the author do not provide personalized recommendations. The author makes no representations as to the accuracy, completeness, or suitability of this information. FXStreet and the author will not be liable for any errors, omissions or any losses, injuries or damages arising from this information and its display or use. Errors and omissions excepted.
The author and FXStreet are not registered investment advisors and nothing in this article is intended to be investment advice.
Recommended Content
Editors’ Picks
EUR/USD clings to daily gains above 1.0650

EUR/USD gained traction and turned positive on the day above 1.0650. The improvement seen in risk mood following the earlier flight to safety weighs on the US Dollar ahead of the weekend and helps the pair push higher.
GBP/USD recovers toward 1.2450 after UK Retail Sales data

GBP/USD reversed its direction and advanced to the 1.2450 area after touching a fresh multi-month low below 1.2400 in the Asian session. The positive shift seen in risk mood on easing fears over a deepening Iran-Israel conflict supports the pair.
Gold holds steady at around $2,380 following earlier spike

Gold stabilized near $2,380 after spiking above $2,400 with the immediate reaction to reports of Israel striking Iran. Meanwhile, the pullback seen in the US Treasury bond yields helps XAU/USD hold its ground.
Bitcoin Weekly Forecast: BTC post-halving rally could be partially priced in Premium

Bitcoin price shows no signs of directional bias while it holds above $60,000. The fourth BTC halving is partially priced in, according to Deutsche Bank’s research.
Week ahead – US GDP and BoJ decision on top of next week’s agenda

US GDP, core PCE and PMIs the next tests for the Dollar. Investors await BoJ for guidance about next rate hike. EU and UK PMIs, as well as Australian CPIs also on tap.
