EUR/USD Current Price: 1.0920
View Live Chart for the EUR/USD
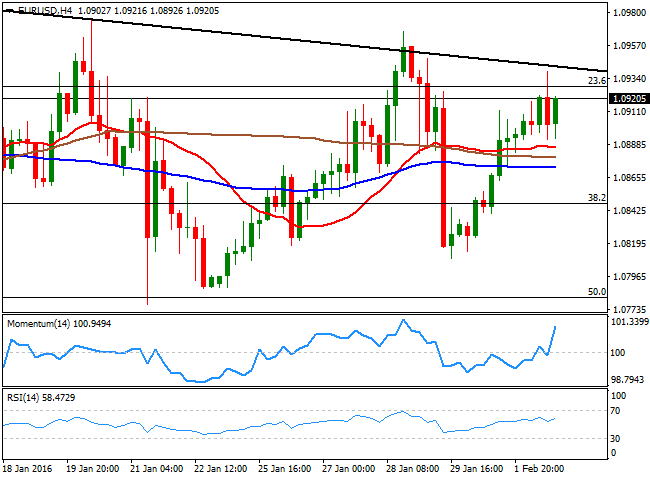
The EUR/USD pair advanced up to a daily high of 1.0939 this Tuesday, but was unable to advance further beyond the top of its recent range, easing towards the current 1.0890 region, where short term buying interest surged again. The pair recovered above the 1.0900 as the dollar was under pressure against all of its major rivals, exception made by the Aussie, hit by the RBA early Asia. The data front didn't help the EUR as the Producer Price Index in the region fell by 0.8% in December, compared to the previous month, and edged down to -3.0% compared to a year before. In Germany, however, unemployment fell to its lowest since German unification, down to 6.2% in January. In the US, Kansas FED's George repeated that upcoming rate hikes will depend on the economic outlook, and that the Central Bank should continue with a gradual pace of rate hikes. Also, oil prices plummeted, with WTI futures briefly falling below $30.00 a barrel, spurring some risk aversion and sending worldwide stocks into the red.
As for the pair, the EUR/USD continues pressuring the top of its recent range, but remains unable to break higher, moreover as investors entered wait-and-see mode ahead of the US Nonfarm Payroll report next Friday. Technically, the upside is favored according to the 4 hours chart, as the Momentum indicator heads sharply higher within bullish territory, while the RSI also heads north around 56, while the price stands above its moving averages. Nevertheless, the 1.0930/60 region has proved strong ever since mid December, and unless a strong break above it, the upside will remain limited.
Support levels: 1.0880 1.0845 1.0810
Resistance levels: 1.0930 1.0960 1.1000
EUR/JPY Current price: 131.12
View Live Chart for the EUR/JPY
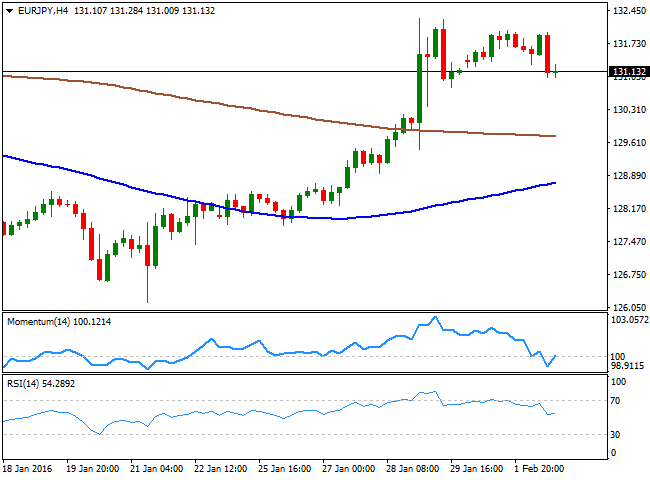
The Japanese Yen strengthened amid risk aversion, leading to a decline in the EUR/JPY that accelerated in the American afternoon. The pair flirted with the 131.00 level, but so far hold above it. Nevertheless, the risk towards the downside has increased, as in the 1 hour chart, the technical indicators head south below their mid-lines. In the same chart however, the 100 SMA heads north below current price, offering an immediate support around 130.80. In the 4 hours chart, the pair has filled a gap left at the weekly opening, while the technical indicators are losing bearish strength below their mid-lines, suggesting additional confirmations are required to see a downward move this Wednesday.
Support levels: 130.80 130.40 130.00
Resistance levels: 132.00 132.45 132.90
GBP/USD Current price: 1.4417
View Live Chart for the GBP/USD
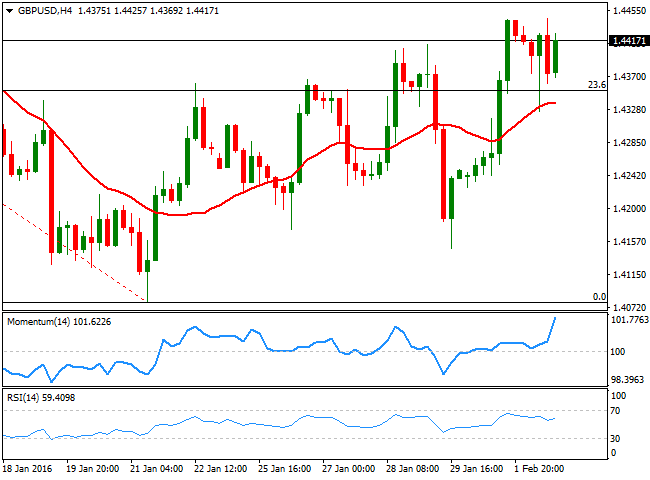
The British Pound looks quite constructive, having advanced up to 1.4445 against the greenback, and trading nearby at the end of the day. The GBP/USD fell down to 1.4325 in the European morning, weighed by worse-than-expected UK data, as the Construction PMI for January fell to 55.0 from 57.8 in December, showing the weakest expansion in the sector for nine months. The technical picture has become bullish in the short term, with the price now recovering above its 20 SMA and the technical indicators gaining bullish strength above their mid-lines in the 1 hour chart. In the 4 hours chart, , the pair bounced earlier in the day from its 20 SMA which converges with the mentioned daily low, while the Momentum indicator heads sharply higher well above its 100 level and the RSI head slightly north around 59. Also, the pair seems to have broken above the 23.6% of its latest weekly decline, with the 38.2% retracement of the same rally converging with the 200 EMA in the 4 hours chart at 1.4530, being a probable bullish target in the case of further advances.
Support levels: 1.4395 1.4360 1.4325
Resistance levels: 1.4445 1.4490 1.4530
USD/JPY Current price: 120.03
View Live Chart for the USD/JPY
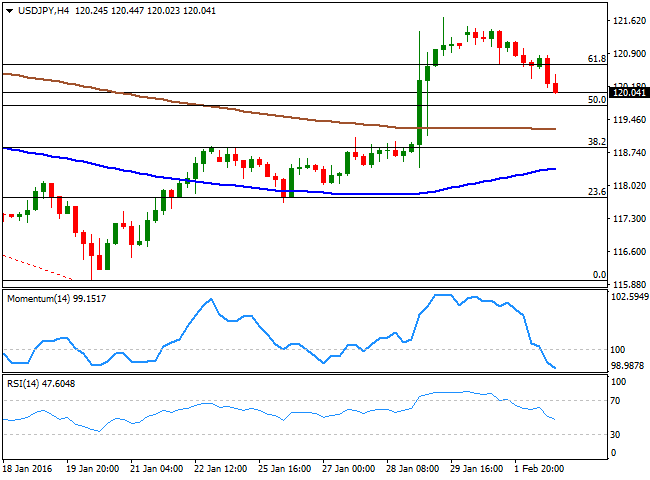
The USD/JPY pair sunk in the American session, as risk sentiment picked up following a triple digit decline in the DJIA. Crude oil prices fell towards $30.00 a barrel, and resume its roll of market leader, although China also had a part in ongoing risk-averse trading as the PBoC to intervene markets once again, by injecting 100bn Yuan. The 1 hour chart for the pair shows that the price is currently a couple of pips below its 100 SMA, while the technical indicators are giving signs of downward exhaustion near oversold territory, limiting chances of a downward acceleration. In the 4 hours chart, however, the pair presents a strong bearish tone, given that the technical indicators head sharply lower within bearish territory. The pair has now its next support around 119.75, the 50% retracement of the latest daily decline. A break below this last should signal further declines for this Wednesday, with 118.90 as a probable bearish target.
Support levels: 119.75 119.35 118.90
Resistance levels: 120.30 120.70 121.20
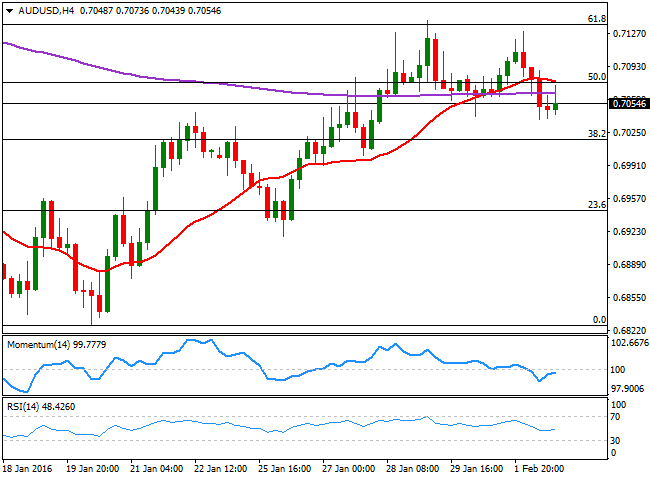
AUD/USD Current price: 0.7054
View Live Chart for the AUD/USD
The Aussie fell against all of its major rivals, as the RBA Governor, Glenn Stevens, joined the easing bias policy during the monthly meeting of the Central Bank. Stevens left rates unchanged, but also left the door opened for further monetary easing if required, albeit he sounded a bit more optimistic about the local economy, saying that "there were reasonable prospects for continued growth in the economy, with inflation close to target." Anyway, the currency was also affected by nose-diving commodities, and the AUD/USD fell down to 0.7038, having been unable to recover much afterwards. Technically, the 1 hour chart shows that the price is being now capped by a bearish 20 SMA, while the technical indicators are turning south after a limited upward correction from oversold readings. In the 4 hours chart, the 20 SMA also caps the upside around 0.7090, the immediate resistance, while the technical indicators lack directional strength and hold below their mid-lines, maintaining the risk towards the downside.
Support levels: 0.7040 0.7000 0.6970
Resistance levels: 0.7080 0.7105 0.7150
Information on these pages contains forward-looking statements that involve risks and uncertainties. Markets and instruments profiled on this page are for informational purposes only and should not in any way come across as a recommendation to buy or sell in these assets. You should do your own thorough research before making any investment decisions. FXStreet does not in any way guarantee that this information is free from mistakes, errors, or material misstatements. It also does not guarantee that this information is of a timely nature. Investing in Open Markets involves a great deal of risk, including the loss of all or a portion of your investment, as well as emotional distress. All risks, losses and costs associated with investing, including total loss of principal, are your responsibility. The views and opinions expressed in this article are those of the authors and do not necessarily reflect the official policy or position of FXStreet nor its advertisers. The author will not be held responsible for information that is found at the end of links posted on this page.
If not otherwise explicitly mentioned in the body of the article, at the time of writing, the author has no position in any stock mentioned in this article and no business relationship with any company mentioned. The author has not received compensation for writing this article, other than from FXStreet.
FXStreet and the author do not provide personalized recommendations. The author makes no representations as to the accuracy, completeness, or suitability of this information. FXStreet and the author will not be liable for any errors, omissions or any losses, injuries or damages arising from this information and its display or use. Errors and omissions excepted.
The author and FXStreet are not registered investment advisors and nothing in this article is intended to be investment advice.
Recommended Content
Editors’ Picks
AUD/USD remained bid above 0.6500

AUD/USD extended further its bullish performance, advancing for the fourth session in a row on Thursday, although a sustainable breakout of the key 200-day SMA at 0.6526 still remain elusive.
EUR/USD faces a minor resistance near at 1.0750

EUR/USD quickly left behind Wednesday’s small downtick and resumed its uptrend north of 1.0700 the figure, always on the back of the persistent sell-off in the US Dollar ahead of key PCE data on Friday.
Gold holds around $2,330 after dismal US data

Gold fell below $2,320 in the early American session as US yields shot higher after the data showed a significant increase in the US GDP price deflator in Q1. With safe-haven flows dominating the markets, however, XAU/USD reversed its direction and rose above $2,340.
Bitcoin price continues to get rejected from $65K resistance as SEC delays decision on spot BTC ETF options

Bitcoin (BTC) price has markets in disarray, provoking a broader market crash as it slumped to the $62,000 range on Thursday. Meanwhile, reverberations from spot BTC exchange-traded funds (ETFs) continue to influence the market.
US economy: slower growth with stronger inflation

The dollar strengthened, and stocks fell after statistical data from the US. The focus was on the preliminary estimate of GDP for the first quarter. Annualised quarterly growth came in at just 1.6%, down from the 2.5% and 3.4% previously forecast.
