EUR/USD Current Price: 1.0895
View Live Chart for the EUR/USD
China and oil prices continue being the main market's focus this Monday, with the stocks in the second world's largest economy opening sharply lower and crude extending its decline towards $28.00 a barrel, after sanctions on Iran oil's exports were finally lifted. The Shanghai composite finally closed in the green by a few points, while the black gold recovered the lost ground and trades near Friday's close. Currencies, however, are unable to attract investors, trading within limited intraday ranges and mostly directionless. Additionally, US markets will remain closed due to a local holiday, meaning that there are little chances of some action for the second half of the day.
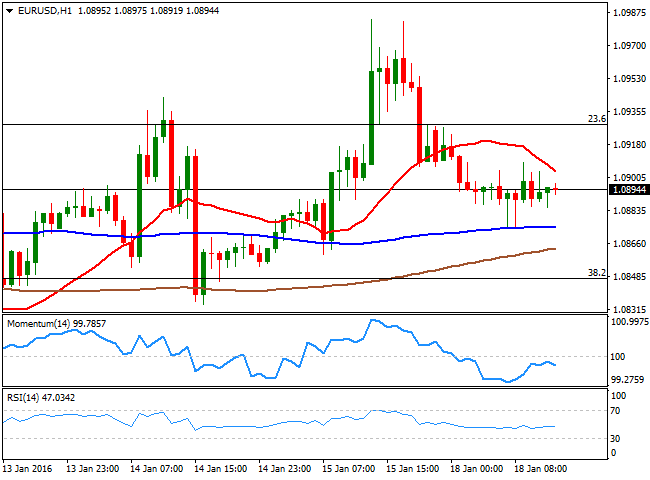
As for the EUR/USD pair, it remained capped by the 23.6% Fibonacci retracement at 1.0925, and trades a handful of pips below the 1.0900 level. Short term, a slightly negative tone surges from the 1 hour chart, as the price is now below a bearish 20 SMA, while the technical indicators are turning south below their mid-lines. Nevertheless, the 100 SMA has provided some support around 1.0870. In the 4 hours chart, the Momentum indicator has crossed its mid-line towards the downside, but remains within neutral territory, as the RSI indicator holds flat around its mid-line whilst the price stands above is moving averages.
Support levels: 1.0870 1.0845 1.0800
Resistance levels: 1.0925 1.0965 1.1000
GBP/USD Current price: 1.4286
View Live Chart for the GBP/USD
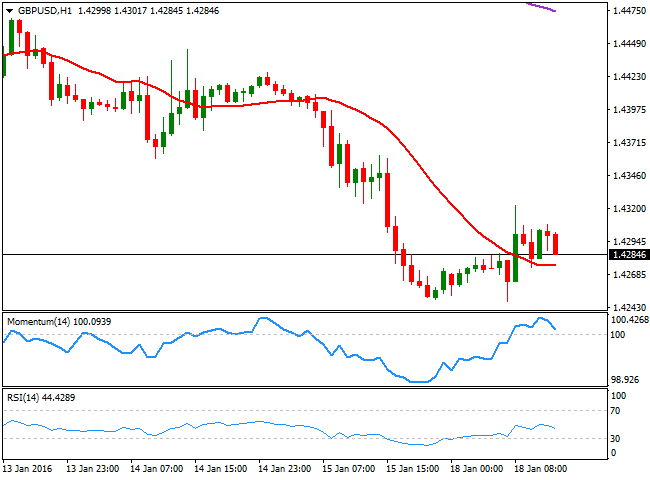
The British Pound has managed to bounce some against its American rival from a fresh multi-year low posted at 1.4247 at the beginning of the day, a couple of pips below Friday's one. But the GBP/USD strong bearish trend prevails, as the pair has failed to sustain its intraday gains and is slowly grinding lower. Short term, the 1 hour chart shows that the technical indicators have turned sharply lower, with the RSI already below its mid-line, anticipating some additional declines. In the 4 hours chart, the price is still well below a bearish 20 SMA, currently around 1.4350, while the technical indicators are turning south within bearish territory after correcting oversold readings, all of which supports a downward continuation on a break below 1.4250.
Support levels: 1.4250 1.4220 1.4185
Resistance levels: 1.4295 1.4350 1.4390
USD/JPY Current price: 117.32
View Live Chart for the USD/JPY
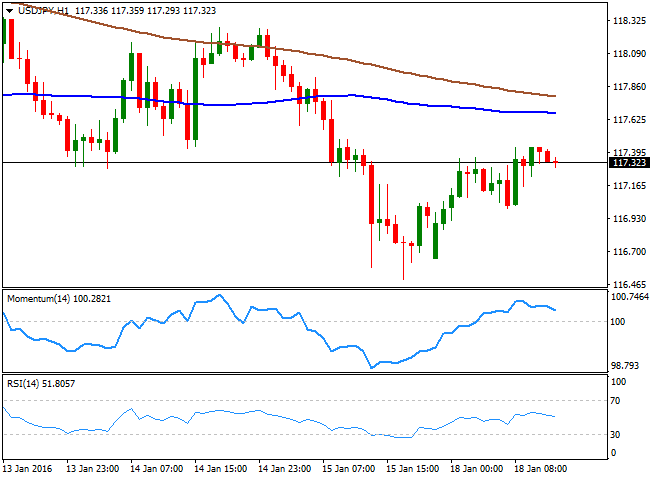
Upside limited, slides expected below 116.90. The USD/JPY pair opened the week lower, but quickly advanced above the 117.00 level, extending up to 117.43 in the European morning. With the US on holidays and no data scheduled for what's left of the day, the pair is consolidating near the mentioned high, and the 1 hour chart shows that the rally stalled far below its moving averages, while the technical indicators have turned south above their mid-lines, limiting chances of a stronger advance. In the 4 hours chart, technical readings also suggest that the upside is limited, given that the technical indicators stand within bearish territory, whilst the 100 SMA extended further its decline, standing now around 118.70. Should the pair resume its decline and fall below 116.90, the bearish acceleration can take the pair down to 116.50, en route to 116.10.
Support levels: 116.90 116.50 116.10
Resistance levels: 117.40 117.75 118.10
AUD/USD Current price: 0.6884
View Live Chart for the AUD/USD
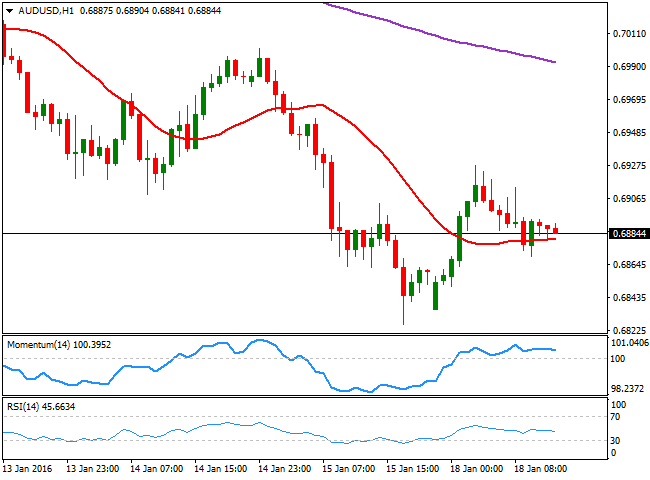
The Australian dollar started the week with a strong note, advancing up to 0.6927 against the greenback. Although Asian stocks wavered at the beginning of the week, a slight improve in market's sentiment helped the Aussie correct part of the sharp losses seen by the end of last week. Nevertheless, the bearish trend prevails and the 1 hour chart shows that the price is struggling around a flat 20 SMA, while the technical indicators have turned south around their mid-lines, increasing the risk of a bearish run. In the 4 hours chart, the price is below a strongly bearish 20 SMA, currently around the mentioned daily high, while the technical indicators remain well into negative territory, supporting additional declines on a break below 0.6860, the immediate support.
Support levels: 0.6860 0.6825 0.6780
Resistance levels: 0.6890 0.6925 0.6960
Information on these pages contains forward-looking statements that involve risks and uncertainties. Markets and instruments profiled on this page are for informational purposes only and should not in any way come across as a recommendation to buy or sell in these assets. You should do your own thorough research before making any investment decisions. FXStreet does not in any way guarantee that this information is free from mistakes, errors, or material misstatements. It also does not guarantee that this information is of a timely nature. Investing in Open Markets involves a great deal of risk, including the loss of all or a portion of your investment, as well as emotional distress. All risks, losses and costs associated with investing, including total loss of principal, are your responsibility. The views and opinions expressed in this article are those of the authors and do not necessarily reflect the official policy or position of FXStreet nor its advertisers. The author will not be held responsible for information that is found at the end of links posted on this page.
If not otherwise explicitly mentioned in the body of the article, at the time of writing, the author has no position in any stock mentioned in this article and no business relationship with any company mentioned. The author has not received compensation for writing this article, other than from FXStreet.
FXStreet and the author do not provide personalized recommendations. The author makes no representations as to the accuracy, completeness, or suitability of this information. FXStreet and the author will not be liable for any errors, omissions or any losses, injuries or damages arising from this information and its display or use. Errors and omissions excepted.
The author and FXStreet are not registered investment advisors and nothing in this article is intended to be investment advice.
Recommended Content
Editors’ Picks
GBP/USD stays below 1.2450 after UK employment data

GBP/USD trades marginally lower on the day below 1.2450 in the early European session on Tuesday. The data from the UK showed that the ILO Unemployment Rate in February rose to 4.2% from 4%, weighing on Pound Sterling.
EUR/USD steadies above 1.0600, awaits German ZEW and Powell speech

EUR/USD is holding above 1.0600 in the European morning on Tuesday, having hit fresh five-month lows. The pair draws support from sluggish US Treasury bond yields but the rebound appears capped amid a stronger US Dollar and risk-aversion. Germany's ZEW survey and Powell awaited.
Gold price holds steady below $2,400 mark, bullish potential seems intact

Gold price oscillates in a narrow band on Tuesday and remains close to the all-time peak. The worsening Middle East crisis weighs on investors’ sentiment and benefits the metal. Reduced Fed rate cut bets lift the USD to a fresh YTD top and cap gains for the XAU/USD.
SOL primed for a breakout as it completes a rounding bottom pattern

Solana price has conformed to the broader market crash, following in the steps of Bitcoin price that remains in the red below the $65,000 threshold. For SOL, however, the sensational altcoin could have a big move in store.
Key economic and earnings releases to watch

The market’s focus may be on geopolitical issues at the start of this week, but there is a large amount of economic data and more earnings releases to digest in the coming days.


