EUR/USD Current Price: 1.0916
View Live Chart for the EUR/USD
Risk aversion was the main market mover last week, with oil prices plummeting to over 12-year lows, ending the week below $30.00 a barrel. As for the EUR, the common currency benefited from its funding-currency condition, although it remained range bound against its American rival, still unable to find a certain direction. The pair advanced up to 1.0984 on Friday, but closed the week almost flat, a few pips below the opening, around 1.0916. For this week, the calendar will be quite busy in Europe, but the ECB meeting next Thursday will likely gather the most attention, as latest Draghi's decision rocked the forex board.
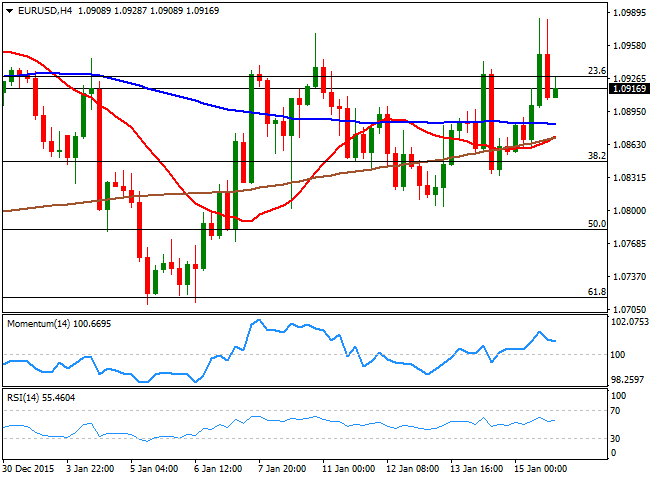
Rallies towards the 1.1000 figure continued to attract selling interest, but a slightly bullish tone prevails according to technical readings, given that the pair has recovered sharply from the 1.0710 region, tested early January, the 61.8% retracement of the December rally, and currently struggles to overcome the 23.6% retracement of the same rally at 1.0925. In the daily chart, the technical indicators head higher within neutral territory, while the price has been moving back and forth around a horizontal 20 SMA. Also in the daily chart, a bearish 100 SMA has contained advances last Friday, currently offering a dynamic resistance around 1.0965, although the key for a bullish breaking is 1.1060, the December high and the 200 DMA. In the 4 hours chart, the price has advanced above its moving averages, but they are all confined to a tight 20 pips range and lack directional strength, while the technical indicators hold above their mid-lines, but are currently flat.
Support levels: 1.0880 1.0845 1.0800
Resistance levels: 1.0925 1.0965 1.1000
EUR/JPY Current price: 127.64
View Live Chart for the EUR/JPY
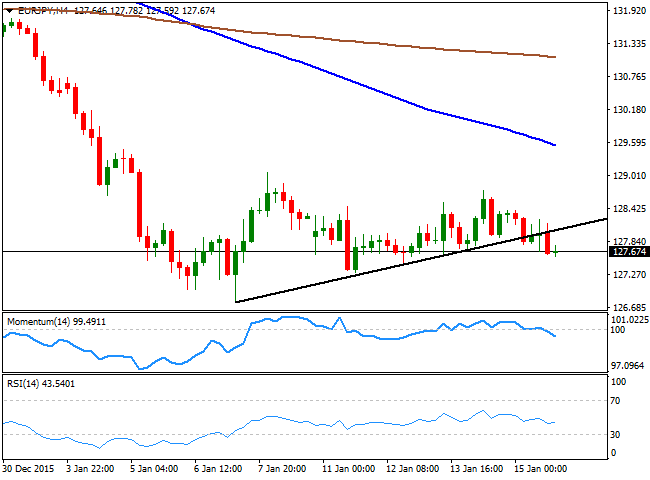
The EUR/JPY declined for a sixth week in-a-row, although the slide was quite limited, down by some 40 pips weekly basis. With risk sentiment leading the way, both currencies were on demand, resulting in a tight range for the pair that anyway remained within 9-monht lows. Technically, the daily chart shows that the price remained far below its moving averages, while the technical indicators have turned lower in oversold territory. In the 4 hours chart, the price has broken below a short term ascendant trend line, while the technical indicators head south below their mid-lines, and the price stands below its moving averages all of which maintains the risk towards the downside. January 11th low at 12.30 is the immediate support, followed by 126.77, January 7th low. It will take a break below this last to confirm a steeper decline, with 124.40 being the next strong support and a probable target for this week.
Support levels: 127.30 126.75 126.20
Resistance levels: 128.10 128.55 129.00
GBP/USD Current price: 1.4251
View Live Chart for the GBP/USD
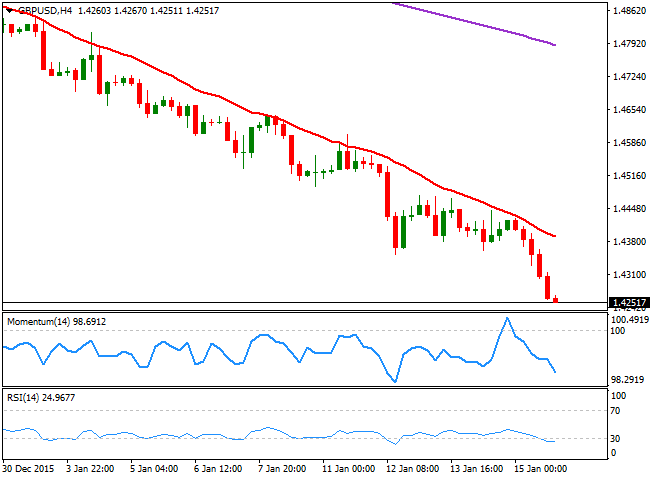
Pound's unstoppable slide extended down to 1.4251 against the greenback, where the pair closed the week. The GBP/USD pair is at its lowest since May 2010, as the British currency has been weighed by poor UK data that fueled fears of a slowing recovery, while uncertainty arises over a possible Brexit, as a referendum on the subject looms. Also affecting the Sterling these days is oil, as the FTSE 100, the London benchmark is quite dependant of commodities. Technically, the pair is extremely oversold in its daily chart, with the RSI indicator heading south around 16. And despite there are no technical signs of a reversal, the risk of a sharp upward corrective movement has become extremely high. Shorter term, the 4 hours chart the price extended further lower beyond a bearish 20 SMA, whilst the technical indicators continue heading strongly south, despite being in oversold territory, all of which support some additional declines for this Monday. Upward corrective movements can extend up to 1.4350, where some former lows can offer some resistance.
Support levels: 1.4220 1.4185 1.4150
Resistance levels: 1.4295 1.4350 1.4390
USD/JPY Current price: 116.95
View Live Chart for the USD/JPY
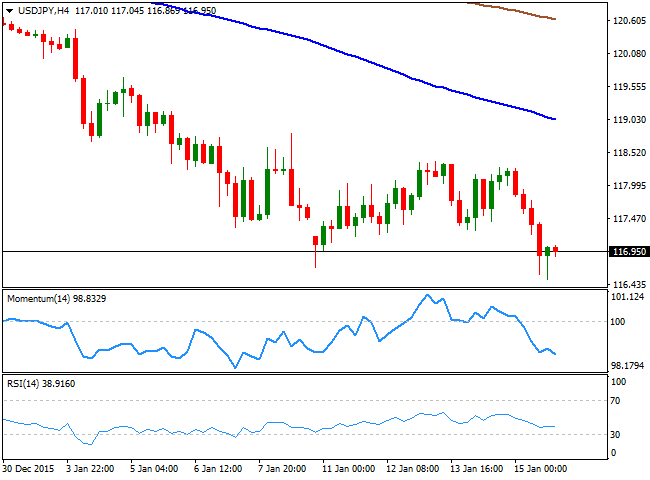
The American dollar gave up all of its weekly gains against the greenback on Friday, following worse-than-expected data, as US Retail Sales came out negative for December, while Industrial Production during the same month, shrunk by 0.4%, doubling expectations of a 0.2% decline. With the Japanese yen on demand amid ongoing risk sentiment, the USD/JPY needed little to fall, and on Friday, fell down to 116.50, its lowest since late August. Having closed the week a few pips below the 117.00 level, the daily chart shows that the technical indicators have resumed their declines near oversold territory after a limited upward corrective move, while the price remains well below the 100 and 200 SMAs. In the 4 hours chart, the technical indicators present strong bearish slopes well below their mid-lines, while the 100 and 200 SMA have accelerated their declines far above the current level, all of which supports some further declines towards 116.10 in the short term. A break below this last should fuel the decline by triggering panic selling, exposing the 115.00 price zone.
Support levels: 116.50 116.10 115.80
Resistance levels: 117.10 117.40 117.75
AUD/USD Current price: 0.6860
View Live Chart for the AUD/USD
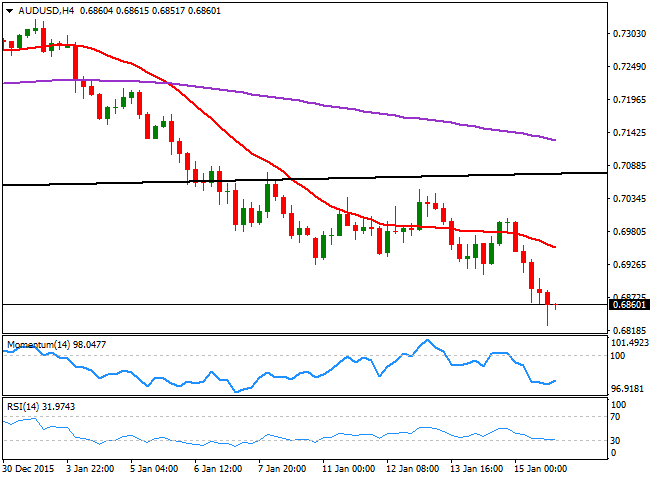
The Australian dollar fell to fresh multi-year lows against its American rival, with the pair plummeting to 0.6826 last Friday, its lowest since March 2009. Having closed in the red for a second week in-a-row, the Aussie is suffering from falling commodity prices, with investors dropping the currency, despite improving local employment and trade data. This upcoming week, China will release plenty of macroeconomic data, staring next Tuesday Retail Sales and GDP figures. Should the readings suggest that Chinese economic slowdown has deepened, the Australian dollar will probably slump. In the meantime, the technical picture supports some additional declines, with the 1 daily chart showing that the price has moved further below its moving averages and below the daily ascendant trend line broken early this month, while the technical indicators maintain their bearish momentum near oversold territory. In the 4 hours chart, the technical indicators are giving signs of downside exhaustion, turning north near oversold levels, while the price remains below a strongly bearish 20 SMA, suggesting at least some consolidation before a new leg south.
Support levels: 0.6825 0.6780 0.6735
Resistance levels: 0.6905 0.6960 0.7000
Information on these pages contains forward-looking statements that involve risks and uncertainties. Markets and instruments profiled on this page are for informational purposes only and should not in any way come across as a recommendation to buy or sell in these assets. You should do your own thorough research before making any investment decisions. FXStreet does not in any way guarantee that this information is free from mistakes, errors, or material misstatements. It also does not guarantee that this information is of a timely nature. Investing in Open Markets involves a great deal of risk, including the loss of all or a portion of your investment, as well as emotional distress. All risks, losses and costs associated with investing, including total loss of principal, are your responsibility. The views and opinions expressed in this article are those of the authors and do not necessarily reflect the official policy or position of FXStreet nor its advertisers. The author will not be held responsible for information that is found at the end of links posted on this page.
If not otherwise explicitly mentioned in the body of the article, at the time of writing, the author has no position in any stock mentioned in this article and no business relationship with any company mentioned. The author has not received compensation for writing this article, other than from FXStreet.
FXStreet and the author do not provide personalized recommendations. The author makes no representations as to the accuracy, completeness, or suitability of this information. FXStreet and the author will not be liable for any errors, omissions or any losses, injuries or damages arising from this information and its display or use. Errors and omissions excepted.
The author and FXStreet are not registered investment advisors and nothing in this article is intended to be investment advice.
Recommended Content
Editors’ Picks
EUR/USD regains traction, recovers above 1.0700

EUR/USD regained its traction and turned positive on the day above 1.0700 in the American session. The US Dollar struggles to preserve its strength after the data from the US showed that the economy grew at a softer pace than expected in Q1.
GBP/USD returns to 1.2500 area in volatile session

GBP/USD reversed its direction and recovered to 1.2500 after falling to the 1.2450 area earlier in the day. Although markets remain risk-averse, the US Dollar struggles to find demand following the disappointing GDP data.
Gold climbs above $2,340 following earlier drop

Gold fell below $2,320 in the early American session as US yields shot higher after the data showed a significant increase in the US GDP price deflator in Q1. With safe-haven flows dominating the markets, however, XAU/USD reversed its direction and rose above $2,340.
XRP extends its decline, crypto experts comment on Ripple stablecoin and benefits for XRP Ledger

Ripple extends decline to $0.52 on Thursday, wipes out weekly gains. Crypto expert asks Ripple CTO how the stablecoin will benefit the XRP Ledger and native token XRP.
After the US close, it’s the Tokyo CPI

After the US close, it’s the Tokyo CPI, a reliable indicator of the national number and then the BoJ policy announcement. Tokyo CPI ex food and energy in Japan was a rise to 2.90% in March from 2.50%.
