EUR/USD Current Price: 1.0833
View Live Chart for the EUR/USD
The dollar edged higher this Tuesday, benefited by an improving risk sentiment and a slid in oil prices to fresh multi-year lows, with US sweet, light crude reaching $30.00 a barrel. The common currency, however, is still refusing to give up against the greenback, given that the EUR/USD pair bounced from a daily low of 1.0819, holding within its recent range. But both, the Pound and the Canadian dollar plummeted to fresh multi-year lows, the first on the back of poor local data and the second following oil's prices. In the US, consumer confidence edged up in January, as the IBD/TIPP Economic Optimism Index posted a reading of 47.3 vs. 47.2 in December. The NFIB business optimism index also edged higher, reaching 95.2 in December from a previous 94.8, although missing expectations of 95.4.
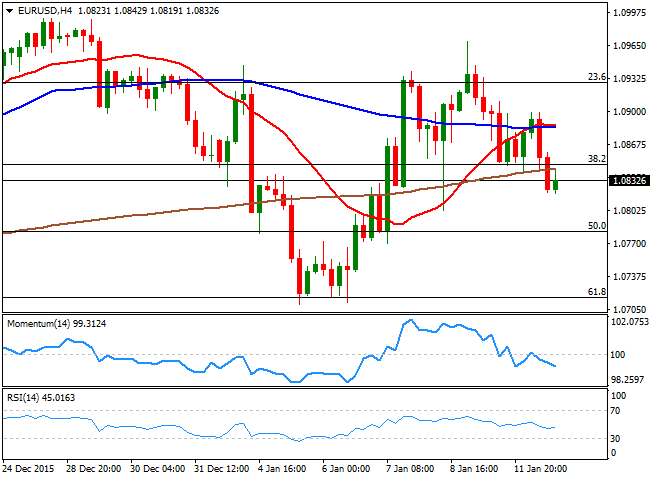
The EUR/USD pair has been consolidating between Fibonacci levels ever since the latest ECB's meeting, when the announcement of the softer extension of QE possible was announced, disappointing EUR sellers. The pair fell down to the 61.8% retracement of the December rally during the past week, but bounced back, with selling interest containing rallies around the 23.6% retracement of the same rally. As long as those extremes hold, the pair has little scope to set a clear directional strength. In the meantime, the bearish potential increases, as in the 4 hours chart the price is below its moving averages, while the Momentum indicator heads lower below its 100 level, and the RSI indicator hovers around 45, in line with additional declines in the short term, particularly on a break below 1.0800.
Support levels: 1.0800 1.0750 1.0715
Resistance levels: 1..0845 1.0880 1.0925
EUR/JPY Current price: 127.57
View Live Chart for the EUR/JPY
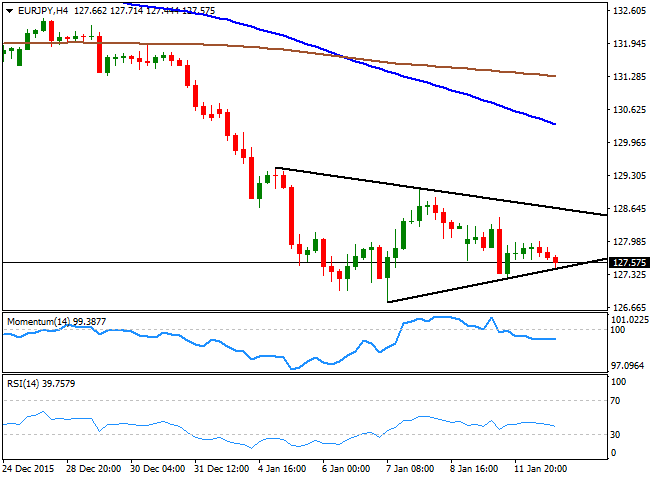
The EUR/JPY pair edged lower on EUR's weakness, now trading near the base of a short term symmetrical triangle, clear in the 4 hours chart. The pair has had no room to advance ever since the year started, as falling Chinese years keep the Japanese currency on demand amid a continued run to safety. The Japanese yen also strengthened on the back of the latest BOJ's decision to modify its economic easing programs, but by far less than market's expectations. Anyway, the EUR/JPY technical picture favors the downside for this Wednesday, as in the 1 hour chart, the price was unable to advance beyond its 100 SMA, while the technical indicators present bearish slopes, lacking momentum, but overall negative. In the 4 hours chart, the technical indicators hold below their mid-lines, but lack directional strength at the time being, while the 100 SMA has extended its decline below the 200 SMA, both well above the current price and supporting some further declines.
Support levels: 127.45 127.15 126.60
Resistance levels: 128.10 128.65 129.10
GBP/USD Current price: 1.4426
View Live Chart for the GBP/USD
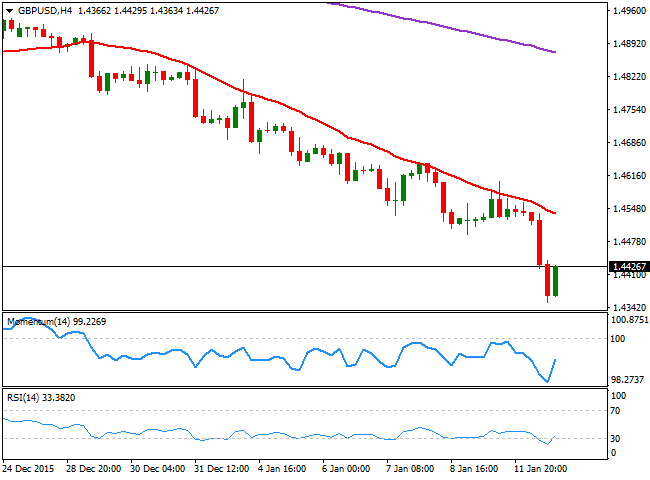
The British Pound nosedived to its lowest since June 2010 against the greenback, reaching 1.4351 before finally bouncing in the American afternoon. The decline of the GBP was triggered by disappointing data, as the UK industrial production declined by 0.7% in November, whilst Manufacturing fell by 0.4% in the same month. The year-on-year readings also missed expectations and fell below the previous readings, fueling the decline of an already bearish GBP/USD. Later in the day, the NIESR monthly GDP estimate, showed that the economy grew by 0.6% in the three months to December 2015, matching the 0.6% gain the three months ending in November 2015, and helping in the late intraday recovery. As for the technical outlook, the bounce is being support by the extreme oversold readings reached earlier in the day, but there's nothing suggesting a bottom has been set. Technically, the 1 hour chart shows that the technical indicators are losing upward strength well below their mid-lines, whilst the 20 SMA heads south above the current level, now offering a strong dynamic resistance around 1.4490. In the 4 hours chart, the technical indicators have bounced from extreme readings although the pair continued to find selling interest on approaches to the 20 SMA, now around 1.4545.
Support levels: 1.4410 1.4380 1.4350
Resistance levels: 1.4455 1.4490 1.4545
USD/JPY Current price: 117.66
View Live Chart for the USD/JPY
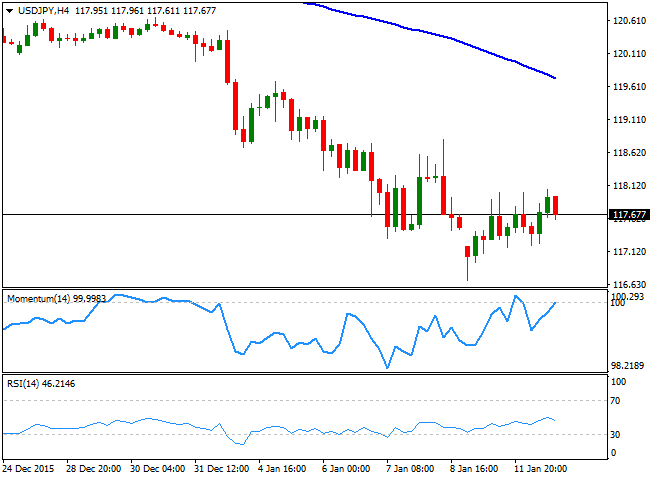
The Japanese yen eased partially against most of its rivals, as a positive close in the Shanghai Composite diluted the strong risk aversion sentiment that favored the safe-haven currency ever since last week. The USD/JPY pair, however, closed the day pretty much unchanged, finding selling interest on advances towards the 118.00 figure. Technically, the daily chart shows that the pair has managed to post a higher high and a higher low, signaling some further downward exhaustion after the pair reached 116.69 at the beginning of the week. The short term picture is showing that the upside is still limited, as in the 1 hour chart, the price is unable to advance beyond its 100 SMA, while the technical indicators are turning lower around their mid-lines. In the 4 hours chart, the price remains well below its moving averages, while the technical indicators are unable to advance beyond their mid-lines, still within bearish territory, unable to confirm a stepper advance as long as the price continues being capped by the mentioned 118.00 level.
Support levels: 117.60 117.20 116.65
Resistance levels: 118.10 118.50 118.95
AUD/USD Current price: 0.6983
View Live Chart for the AUD/USD
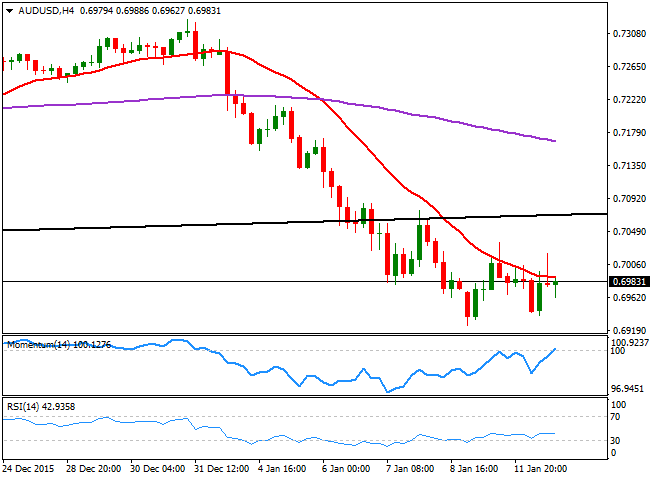
The Aussie advanced some at the beginning of the day, but once again failed to sustain gains above the 0.7000 level against the greenback, ending the day pretty much unchanged and with long shadows both sides of the board in its daily doji. Nevertheless, the AUD/USD pair maintains a bearish perspective in the daily chart, as the RSI indicator has barely corrected extreme oversold readings before turning flat, while the Momentum indicator heads south far below the 100 level. During the upcoming Asian session, China will release its December trade balance figures, with both, exports and imports expected to have declined even further. Should the data disappoint, the Aussie risks further declines, with a break below 0.6900 becoming more likely. In the meantime, the 4 hours chart shows that the price is unable to establish itself above its 20 SMA, while the Momentum indicator heads higher around its 100 level and the RSI indicator holds flat around 43, all of which should limit slides ahead of the Chinese's data release.
Support levels: 0.6955 0.6905 0.6870
Resistance levels: 0.7040 0.7075 0.7120
Information on these pages contains forward-looking statements that involve risks and uncertainties. Markets and instruments profiled on this page are for informational purposes only and should not in any way come across as a recommendation to buy or sell in these assets. You should do your own thorough research before making any investment decisions. FXStreet does not in any way guarantee that this information is free from mistakes, errors, or material misstatements. It also does not guarantee that this information is of a timely nature. Investing in Open Markets involves a great deal of risk, including the loss of all or a portion of your investment, as well as emotional distress. All risks, losses and costs associated with investing, including total loss of principal, are your responsibility. The views and opinions expressed in this article are those of the authors and do not necessarily reflect the official policy or position of FXStreet nor its advertisers. The author will not be held responsible for information that is found at the end of links posted on this page.
If not otherwise explicitly mentioned in the body of the article, at the time of writing, the author has no position in any stock mentioned in this article and no business relationship with any company mentioned. The author has not received compensation for writing this article, other than from FXStreet.
FXStreet and the author do not provide personalized recommendations. The author makes no representations as to the accuracy, completeness, or suitability of this information. FXStreet and the author will not be liable for any errors, omissions or any losses, injuries or damages arising from this information and its display or use. Errors and omissions excepted.
The author and FXStreet are not registered investment advisors and nothing in this article is intended to be investment advice.
Recommended Content
Editors’ Picks
EUR/USD clings to daily gains above 1.0650

EUR/USD gained traction and turned positive on the day above 1.0650. The improvement seen in risk mood following the earlier flight to safety weighs on the US Dollar ahead of the weekend and helps the pair push higher.
GBP/USD recovers toward 1.2450 after UK Retail Sales data

GBP/USD reversed its direction and advanced to the 1.2450 area after touching a fresh multi-month low below 1.2400 in the Asian session. The positive shift seen in risk mood on easing fears over a deepening Iran-Israel conflict supports the pair.
Gold holds steady at around $2,380 following earlier spike

Gold stabilized near $2,380 after spiking above $2,400 with the immediate reaction to reports of Israel striking Iran. Meanwhile, the pullback seen in the US Treasury bond yields helps XAU/USD hold its ground.
Bitcoin Weekly Forecast: BTC post-halving rally could be partially priced in Premium

Bitcoin price shows no signs of directional bias while it holds above $60,000. The fourth BTC halving is partially priced in, according to Deutsche Bank’s research.
Geopolitics once again take centre stage, as UK Retail Sales wither

Nearly a week to the day when Iran sent drones and missiles into Israel, Israel has retaliated and sent a missile into Iran. The initial reports caused a large uptick in the oil price.
