EUR/USD Current Price: 1.0880
View Live Chart for the EUR/USD
The American dollar closed the day mixed as once again, Chinese stocks' slump on poor local data spurred uncertainty among investors and led to another journey of losses, worldwide. China’s CPI remained muted while factory-gate prices fell more than forecast, extending its decline to a record 46 months by falling by 5.9% in November. The macroeconomic calendar was quite light, as Europe only released the Sentix investors confidence index for January down to 9.6 from the previous 15.7, while in the US, labor market conditions improved in December according to official data, and in line with the strong jobs' report released last Friday.
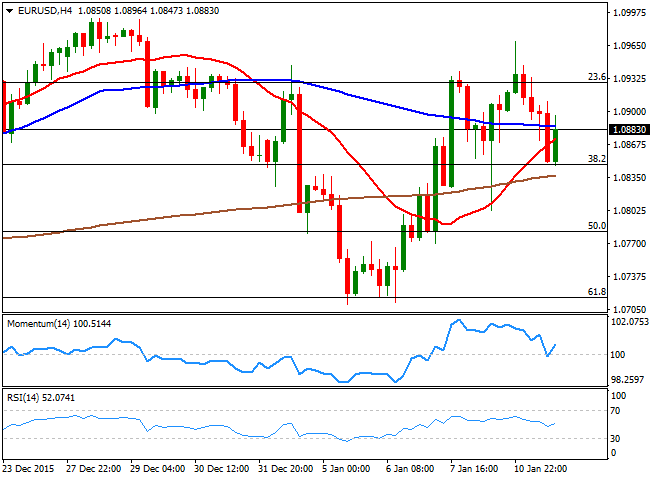
The EUR/USD pair advanced up to 1.0969, before retreating, closing the day in the red below the 1.0900 mark, but having met intraday buying interest around a strong Fibonacci support, the 38.2% retracement of the December bullish run at 1.0845. Sentiment remains risk-averted across the financial world, which means that the EUR may enjoy some temporal demand, although it would take some steady gains beyond the 1.1000 figure to start talking about a more constructive scenario. Technically and according to the 1 hour chart, the technical outlook is neutral-to-bearish, given that the price remains stuck within its recent range, but it's also developing below a now bearish 20 SMA, whilst the technical indicators have turned flat below their mid-lines, after bouncing from near oversold readings. In the 4 hours chart, however, the price is holding above a mild bullish 20 SMA, whilst the technical indicators are currently bouncing from their mid-lines, lacking upward potential, but helping in keep the downside limited.
Support levels: 1.0845 1.0800 1.0750
Resistance levels: 1.0925 1.0960 1.1000
EUR/JPY Current price: 127.68
View Live Chart for the EUR/JPY
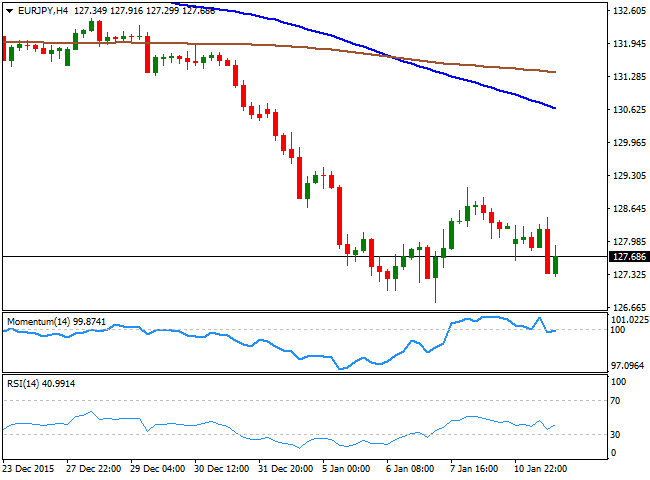
The EUR/JPY pair plummeted on Yen's strength, falling down to a daily low of 127.29 before bouncing some, to end the day below the 128.00 level. The decline accelerated with Wall Street's opening as US stock turned lower following a positive start, fueling demand for the safe haven currency. From a technical point of view, the 1 hour chart shows that the price is currently developing below a bearish 100 SMA, whilst the technical indicators head south within bearish territory after bouncing from oversold levels. In the 4 hours chart, the technical indicators lack directional strength and remain stuck around their mid-lines, yet the price continues developing far below its 100 and 200 SMAs, in line with the dominant bearish trend.
Support levels: 127.50 127.15 126.60
Resistance levels: 128.10 128.65 129.10
GBP/USD Current price: 1.4548
View Live Chart for the GBP/USD
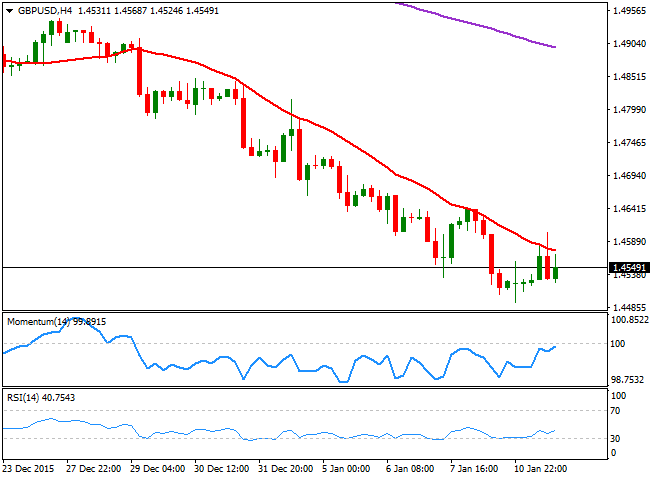
The GBP/USD pair corrected higher this Monday, although the movement has been quite shallow, considering the pair got rejected around the 1.4600 level, barely closing 60 pips higher after falling around 450 in an eight-straight days´ decline. The pair began the day flirting with fresh 9-month lows, reaching 1.4493 before bouncing, and maintains the bearish tone in the longer term outlook. There were no fundamental news released in the UK, yet this Tuesday, the kingdom will offer its latest Industrial and Manufacturing Production figures, expected mostly flat. Should the data result better-than-expected, the Pound's upward corrective movement may extend further. In the meantime, the short term picture is losing the early bullish strength, given that in the 1 hour chart, the technical indicators continue heading south from near overbought levels and are now around their mid-lines, whilst the price is pressuring its 20 SMA. In the 4 hours chart, a strongly bearish 20 SMA, today at 1.4575, continues to cap the upside, while the technical indicators have lost their upward strength below their mid-lines.
Support levels: 1.4535 1.4500 1.4470
Resistance levels: 1.4575 1.4625 1.4660
USD/JPY Current price: 117.22
View Live Chart for the USD/JPY
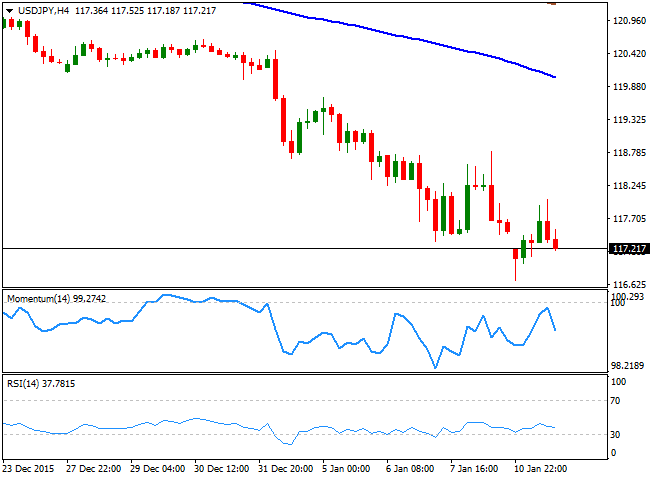
The Japanese yen got benefited for plummeting Chinese stocks, and the USD/JPY pair plummeted to its lowest since last August, reaching a daily low of 116.69 during the Asian session. The Shanghai Composite opened the week with a 5.3% decline, triggering risk aversion and favoring the most the Japanese currency. The pair later bounced up to 118.01, but resumed its decline as Wall Street turned red, and holds a handful of pips above the 117.00 figure ahead of this Tuesday opening. The bearish momentum seen on previous updates remains firm in place, and in the short term, the pair is poised to extend its decline, given that in the 1 hour chart, the price faltered a few pips below a strongly bearish 20 SMA, whilst the technical indicators head sharply lower after crossing their mid-lines towards the downside. In the 4 hours chart, the technical indicators also head south within bearish territory, after failing to overcome their mid-lines, in line with further declines towards August 2015 low at 116.16.
Support levels: 117.10 116.65 116.20
Resistance levels: 117.47 117.80 118.20
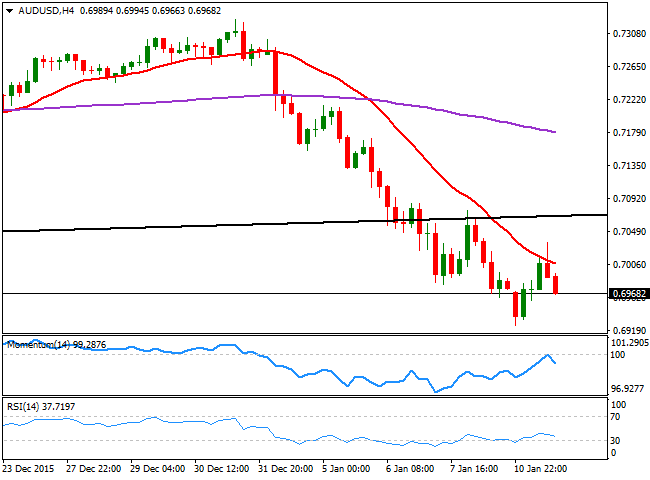
AUD/USD Current price: 0.6968
View Live Chart for the AUD/USD
The Aussie enjoyed some intraday demand against its American rival, and the AUD/USD pair advanced up to 0.7035, despite the ongoing risk environment, trimming, however, most of its daily gains in the American afternoon. Trading below the 0.7000 level, the Australian currency is being weighed by plummeting oil prices, with WTI futures posting fresh lows around $31.00 a barrel in the New York Comex. Technically bearish, the 1 hour chart shows that the price is below its 20 SMA, while the technical indicators hover around their mid-lines, lacking clear directional strength ahead of the Asian opening. In the 4 hours chart, the 20 SMA offered a strong dynamic resistance, and maintains a bearish slope around the 0.7000 figure, while the technical indicators retreated from their mid-lines and head clearly south supporting some additional declines on a break below the immediate support at 0.6955.
Support levels: 0.6955 0.6905 0.6870
Resistance levels: 0.7000 0.7040 0.7075
Information on these pages contains forward-looking statements that involve risks and uncertainties. Markets and instruments profiled on this page are for informational purposes only and should not in any way come across as a recommendation to buy or sell in these assets. You should do your own thorough research before making any investment decisions. FXStreet does not in any way guarantee that this information is free from mistakes, errors, or material misstatements. It also does not guarantee that this information is of a timely nature. Investing in Open Markets involves a great deal of risk, including the loss of all or a portion of your investment, as well as emotional distress. All risks, losses and costs associated with investing, including total loss of principal, are your responsibility. The views and opinions expressed in this article are those of the authors and do not necessarily reflect the official policy or position of FXStreet nor its advertisers. The author will not be held responsible for information that is found at the end of links posted on this page.
If not otherwise explicitly mentioned in the body of the article, at the time of writing, the author has no position in any stock mentioned in this article and no business relationship with any company mentioned. The author has not received compensation for writing this article, other than from FXStreet.
FXStreet and the author do not provide personalized recommendations. The author makes no representations as to the accuracy, completeness, or suitability of this information. FXStreet and the author will not be liable for any errors, omissions or any losses, injuries or damages arising from this information and its display or use. Errors and omissions excepted.
The author and FXStreet are not registered investment advisors and nothing in this article is intended to be investment advice.
Recommended Content
Editors’ Picks
EUR/USD fluctuates in daily range above 1.0600

EUR/USD struggles to gather directional momentum and continues to fluctuate above 1.0600 on Tuesday. The modest improvement seen in risk mood limits the US Dollar's gains as investors await Fed Chairman Jerome Powell's speech.
GBP/USD stabilizes near 1.2450 ahead of Powell speech

GBP/USD holds steady at around 1.2450 after recovering from the multi-month low it touched near 1.2400 in the European morning. The USD struggles to gather strength after disappointing housing data. Market focus shifts to Fed Chairman Powell's appearance.
Gold retreats to $2,370 as US yields push higher

Gold stages a correction on Tuesday and fluctuates in negative territory near $2,370 following Monday's upsurge. The benchmark 10-year US Treasury bond yield continues to push higher above 4.6% and makes it difficult for XAU/USD to gain traction.
XRP struggles below $0.50 resistance as SEC vs. Ripple lawsuit likely to enter final pretrial conference

XRP is struggling with resistance at $0.50 as Ripple and the US Securities and Exchange Commission (SEC) are gearing up for the final pretrial conference on Tuesday at a New York court.
US outperformance continues

The economic divergence between the US and the rest of the world has become increasingly pronounced. The latest US inflation prints highlight that underlying inflation pressures seemingly remain stickier than in most other parts of the world.
