EUR/USD Current price: 1.0892
View Live Chart for the EUR/USD
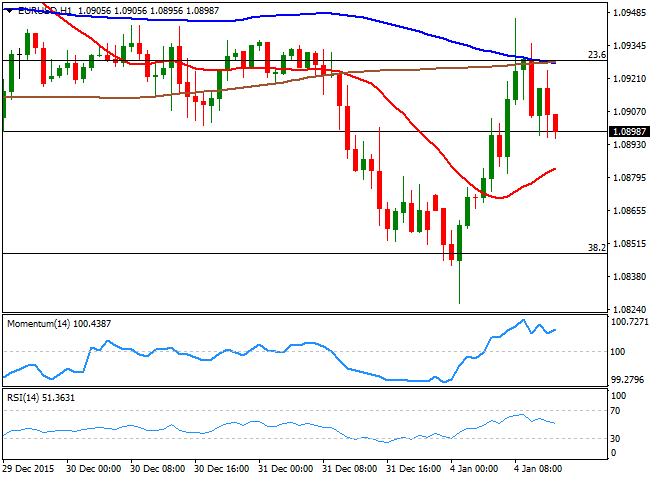
The EUR/USD pair trades below the 1.0900 level following the release of German inflation, much worse than expected. December CPI came out negative, resulting in -0.1% against expectations of a 0.2% advance, while the year-on-year figure resulted at 0.3%. Earlier today however, the release of the Markit manufacturing PMIs of the region resulted quite encouraging, but the common currency is trading on sentiment this Monday, as worse-than-expected Chinese manufacturing data fell further in contraction territory, triggering risk aversion moves all across the financial boards: stocks plummeted in Asian and Europe, while American indexes are pointing to a triple digit negative opening.
The pair advanced up to 1.0945 as local share markets fell, but the greenback is recovering ground ahead of the US opening, and the release of the US manufacturing figures. Technically speaking, the 1 hour chart shows that the price is falling towards its 20 SMA, now the immediate support around 1.0880, while the technical indicators have retreated from overbought territory, in line with further declines. In the 4 hours chart, the price has accelerated below a bearish 20 SMA, while the technical indicators have turned south below their mid-lines, in line with the shorter term bearish tone.
Support levels: 1.0880 1.0845 1.0800
Resistance levels: 1.0910 1.0945 1.1000
GBP/USD Current price: 1.4759
View Live Chart for the GPB/USD
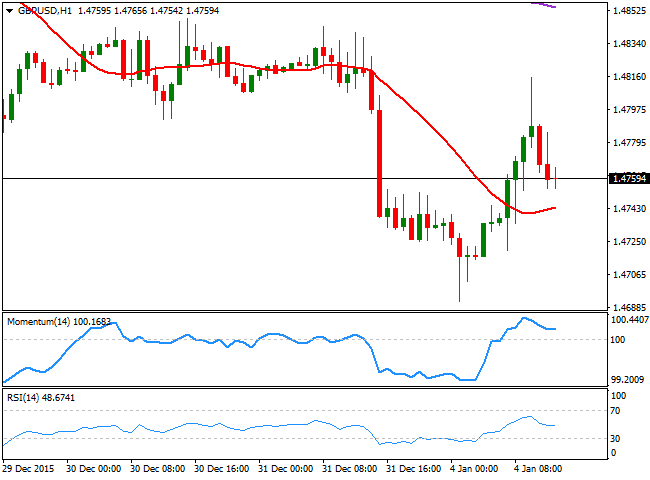
The GBP/USD pair fell down to 1.4691, below the 1.4700 level for the first time since April 2015, but managed to bounce higher, reaching 1.4815 before selling interest surged. Data coming from the UK showed that the December Markit manufacturing PMI fell below expected, printing 51.9, while mortgage approvals rose in November to 70.41K. Despite trading in a more limited range, the GBP/USD pair 1 hour chart shows that the price is above its 20 SMA, while the technical indicators have lost their bearish slopes in positive territory and before reaching their mid-lines. In the 4 hours chart, however, the technical picture is clearly bearish, with the price being capped by its 20 SMA and the technical indicators turning lower within bearish territory.
Support levels: 1.4740 1.4700 1.4660
Resistance levels: 1.4755 1.4790 1.4835
USD/JPY Current price: 119.20
View Live Chart for the USD/JPY
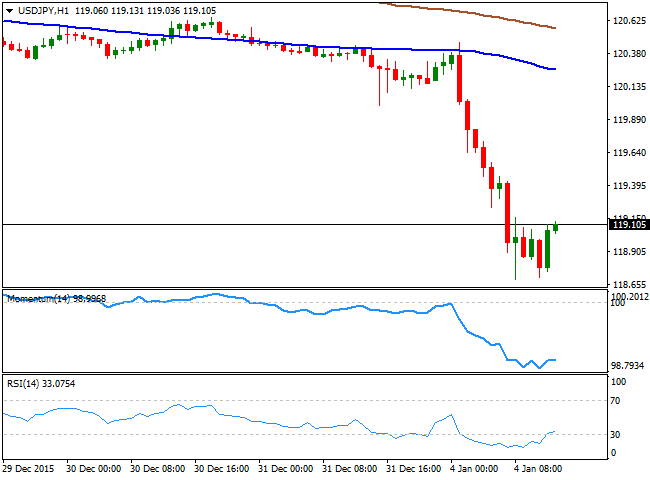
119.60 now caps. After falling down to 118.86, the USD/JPY pair is currently recovering some ground ahead of the US opening. The Japanese yen strengthened during the Asian session as local share markets plummeted, with the decline being exacerbated after the pair triggered stops below the 120.00 mark. Technically, the pair may correct further higher in the short term, as in the 1 hour chart, the technical indicators are heading higher from extreme oversold levels, yet the bearish trend prevails as the price stands far below its 100 and 200 SMAs. In the 4 hours chart, the technical indicators are also correcting extreme oversold readings, but as long as the price holds below 119.60, the risk well remain towards the downside.
Support levels: 120.00 119.60 119.20
Resistance levels: 120.35 120.70 121.10
AUD/USD Current price: 0.7185
View Live Chart for the AUD/USD
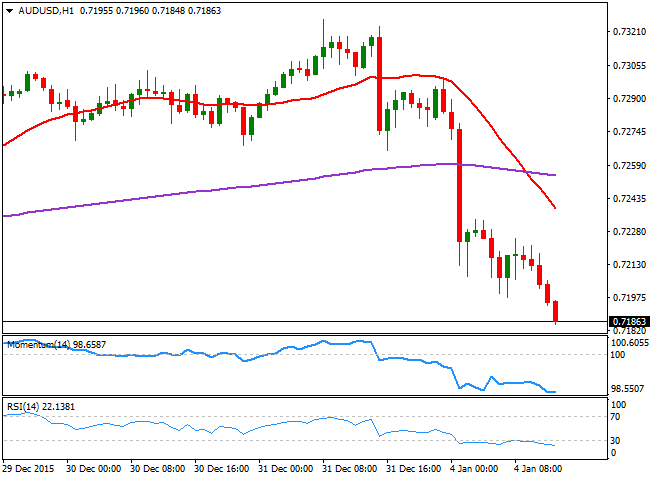
Antipodean currencies suffered the most from Chinese stocks' collapse, with the AUD/USD pair plummeting over 100 pips and trading at its lowest in two weeks, below the 0.7200 level. The 1 hour chart shows that, despite the technical indicators are holding in extreme oversold levels, they maintain their bearish slopes, whilst the price has accelerated sharply lower and stands far above the current level. In the 4 hours chart, the technical bias is also bearish, as the technical indicators head south below within oversold territory, and the price is currently extending below its 20 SMA and the 200 EMA.
Support levels: 0.7160 07130 0.7100
Resistance levels: 0.7200 0.7240 0.7280
Information on these pages contains forward-looking statements that involve risks and uncertainties. Markets and instruments profiled on this page are for informational purposes only and should not in any way come across as a recommendation to buy or sell in these assets. You should do your own thorough research before making any investment decisions. FXStreet does not in any way guarantee that this information is free from mistakes, errors, or material misstatements. It also does not guarantee that this information is of a timely nature. Investing in Open Markets involves a great deal of risk, including the loss of all or a portion of your investment, as well as emotional distress. All risks, losses and costs associated with investing, including total loss of principal, are your responsibility. The views and opinions expressed in this article are those of the authors and do not necessarily reflect the official policy or position of FXStreet nor its advertisers. The author will not be held responsible for information that is found at the end of links posted on this page.
If not otherwise explicitly mentioned in the body of the article, at the time of writing, the author has no position in any stock mentioned in this article and no business relationship with any company mentioned. The author has not received compensation for writing this article, other than from FXStreet.
FXStreet and the author do not provide personalized recommendations. The author makes no representations as to the accuracy, completeness, or suitability of this information. FXStreet and the author will not be liable for any errors, omissions or any losses, injuries or damages arising from this information and its display or use. Errors and omissions excepted.
The author and FXStreet are not registered investment advisors and nothing in this article is intended to be investment advice.
Recommended Content
Editors’ Picks
EUR/USD climbs to 10-day highs above 1.0700

EUR/USD gained traction and rose to its highest level in over a week above 1.0700 in the American session on Tuesday. The renewed US Dollar weakness following the disappointing PMI data helps the pair stretch higher.
GBP/USD extends recovery beyond 1.2400 on broad USD weakness

GBP/USD gathered bullish momentum and extended its daily rebound toward 1.2450 in the second half of the day. The US Dollar came under heavy selling pressure after weaker-than-forecast PMI data and fueled the pair's rally.
Gold struggles around $2,325 despite broad US Dollar’s weakness

Gold reversed its direction and rose to the $2,320 area, erasing a large portion of its daily losses in the process. The benchmark 10-year US Treasury bond yield stays in the red below 4.6% following the weak US PMI data and supports XAU/USD.
Here’s why Ondo price hit new ATH amid bearish market outlook Premium

Ondo price shows no signs of slowing down after setting up an all-time high (ATH) at $1.05 on March 31. This development is likely to be followed by a correction and ATH but not necessarily in that order.
Germany’s economic come back

Germany is the sick man of Europe no more. Thanks to its service sector, it now appears that it will exit recession, and the economic future could be bright. The PMI data for April surprised on the upside for Germany, led by the service sector.


