EUR/USD Current price: 1.0622
View Live Chart for the EUR/USD
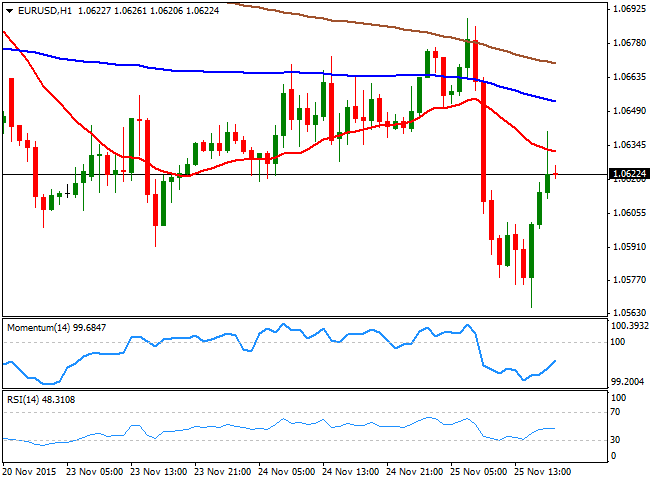
The EUR/USD pair had a volatile session this Wednesday, extending its decline down to a fresh 7-month low of 1.0565 ahead of the US session opening, on renewed speculation that the ECB will extend its stimulus program next December. The common currency started the day advancing up to 1.0688 against its American rival, but plummeted below the 1.0600 figure in the European morning, accelerating its decline after the release of mixed US data. In the US, weekly unemployment claims fell down to 260K in the week ended Nov. 21, the lowest in a month, whilst Durable Goods Orders in October beat expectations by rising 3.0% against a previous decline of 1.2%. Yet, the core PCE remained muted at 1.3%, while personal spending grew by 0.1%in the same month, well below the 0.4% expected and a consumer sentiment index resulted at 91.3 in November, against October reading of 93.1.
The pair bounced in the American afternoon, as investors locked profits ahead of the Thanksgiving holiday, which anticipates little action ahead of the weekend. Nevertheless, the technical picture continues to favor the downside, as in the 1 hour chart, the pair trades below its moving averages, with the 20 SMA attracting sellers around 1.0630 the immediate resistance. In the same chart, the technical indicators have recovered from oversold readings, but remain well below their mid-lines and lacking upward strength. In the 4 hours chart the price is also unable to advance above a mild bearish 20 SMA, whilst the Momentum indicator continues to lack directional strength around its 100 level and the RSI indicator hovers around 44, limiting chances of further recoveries.
Support levels: 1.0590 1.0550 1.0520
Resistance levels: 1.0630 1.0660 1.0695
EUR/JPY Current price: 130.26
View Live Chart for the EUR/JPY
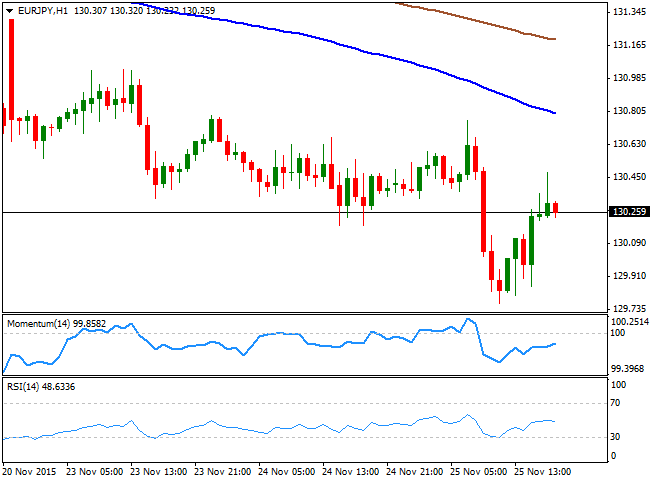
The EUR/JPY pair fell down to 129.76, its lowest since late April, still led by EUR self weakness. The Japanese yen surged at the beginning of the day, helped by BOJ Minutes which showed that policy member have decided to extend the time frame for achieving the 2% inflation target, somehow denying the possibility of a QE extension during the upcoming months. Short term, the 1 hour chart shows that the price's intraday recovery stalled well below a bearish 100 SMA, whilst the technical indicators have resumed their declines well into negative territory after correcting oversold readings, in line with further declines. In the 4 hours chart the technical indicators have bounced from oversold levels, but turned flat well below their mid-lines, in supporting additional declines on a break below 129.80, now the immediate support.
Support levels: 129.80 129.40 129.00
Resistance levels: 130.55 130.90 131.30
GBP/USD Current price: 1.5120
View Live Chart for the GPB/USD
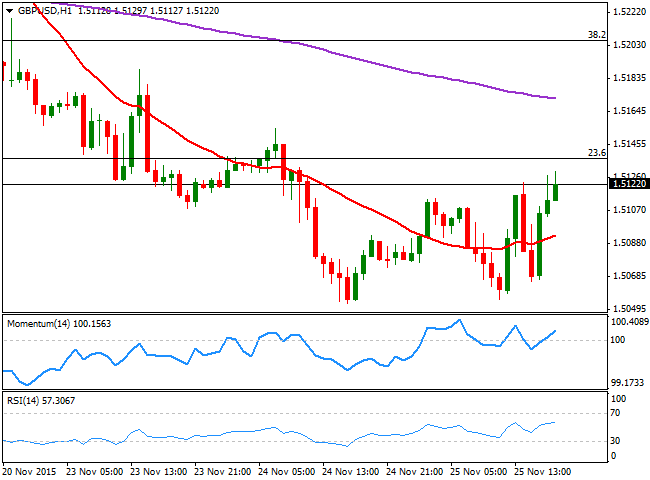
The GBP/USD pair came under increasing downside pressure and fell down to 1.5055 during the European morning, on broad dollar strength and fears a rate hike in the UK will be delayed beyond the first half of 2016. The Pound however, bounced as in the Autumn Forecast statement, the 2016 GDP growth forecast was raised to 2.4% from previous 2.3%, and the pair retook the 1.5100 level as investors profited their long dollars. Trading around its daily high by the end of the day, the 1 hour chart shows that the price is advancing now above a mild bullish 20 SMA, whilst the technical indicators head higher above their mid-lines, favoring some additional gains. In the 4 hours chart, the price is struggling to overcome a strongly bearish 20 SMA, while the technical indicators are about to cross their mid-lines towards the upside, still not confirming further gains. The pair has an immediate Fibonacci resistance at 1.5135, the 23.6% retracement of its latest weekly decline, and it will take some follow through beyond it to confirm a rally up to the 1.5200 level.
Support levels: 1.5050 1.5010 1.4980
Resistance levels: 1.5135 1.5160 1.5190
USD/JPY Current price: 122.67
View Live Chart for the USD/JPY
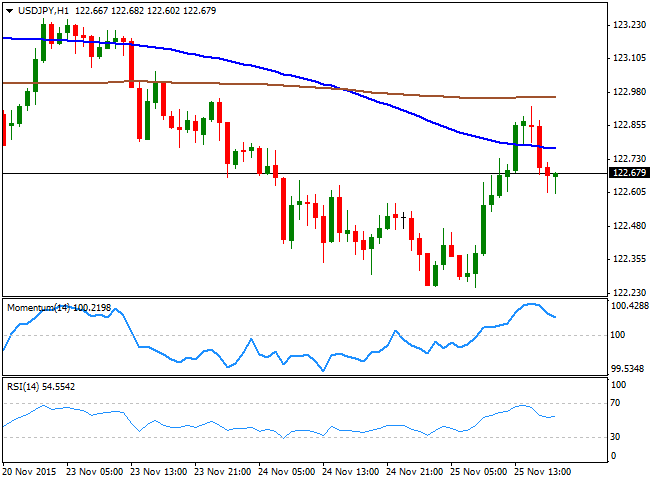
An early Japanese yen advance sent the USD/JPY pair to the 122.20 region, where buyers have been defending the downside over these last three weeks. But the pair bounced during the European morning on dollar's strength, stretching its recover up to 122.98 after the release of US data, far from outstanding, but overall positive and supportive of a December rate hike. The pair however, remain unable to overcome the psychological resistance, and the 1 hour chart shows that a brief advance above the 100 SMA was quickly reverted, whilst the technical indicators have turned lower from near overbought levels, but holding above their mid-lines at the time being, not yet confirming a bearish move. In the 4 hours chart, however, the downward potential is stronger as the technical indicators have resumed their declines below their mid-lines, supporting a bearish continuation on a break below 122.20 the key support for this Thursday.
Support levels: 122.60 122.20 121.70
Resistance levels: 123.00 123.40 123.75
AUD/USD Current price: 0.7247
View Live Chart for the AUD/USD
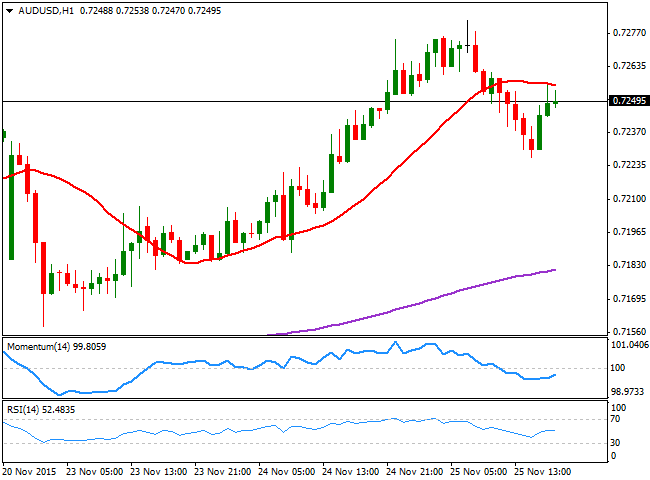
The AUD/USD pair advanced up to 0.7282, its highest in 5 weeks, but ended the day unchanged around 0.7240, having established a higher high and a higher low daily basis, but also giving some signs of upside exhaustion in the daily chart, anticipating some downward movement for the upcoming sessions. The RBA will have its last economic policy meeting of the year next week, and is expected to remain on hold, which should result in some additional Aussie strength, or at least, prevent the currency from sliding. Anyway, the pair needs to extend beyond the highs posted early October around 0.7380, to confirm a steadier advance in term. In the meantime, the short term picture suggests the pair may correct lower, as in 1 chart, the price develops below a horizontal 20 SMA, while the technical indicators head slightly lower below their mid-lines. In the 4 hours chart, however, the price remains above its 20 SMA, while the technical indicators aim north in positive territory, favoring further gains after a short term downward corrective move.
Support levels: 0.7200 0.7150 0.7110
Resistance levels: 0.7285 0.7330 0.7380
Information on these pages contains forward-looking statements that involve risks and uncertainties. Markets and instruments profiled on this page are for informational purposes only and should not in any way come across as a recommendation to buy or sell in these assets. You should do your own thorough research before making any investment decisions. FXStreet does not in any way guarantee that this information is free from mistakes, errors, or material misstatements. It also does not guarantee that this information is of a timely nature. Investing in Open Markets involves a great deal of risk, including the loss of all or a portion of your investment, as well as emotional distress. All risks, losses and costs associated with investing, including total loss of principal, are your responsibility. The views and opinions expressed in this article are those of the authors and do not necessarily reflect the official policy or position of FXStreet nor its advertisers. The author will not be held responsible for information that is found at the end of links posted on this page.
If not otherwise explicitly mentioned in the body of the article, at the time of writing, the author has no position in any stock mentioned in this article and no business relationship with any company mentioned. The author has not received compensation for writing this article, other than from FXStreet.
FXStreet and the author do not provide personalized recommendations. The author makes no representations as to the accuracy, completeness, or suitability of this information. FXStreet and the author will not be liable for any errors, omissions or any losses, injuries or damages arising from this information and its display or use. Errors and omissions excepted.
The author and FXStreet are not registered investment advisors and nothing in this article is intended to be investment advice.
Recommended Content
Editors’ Picks
EUR/USD comes under pressure near 1.0630

Further gains in the Greenback encourage sellers to maintain their control over the risk complex, forcing EUR/USD to retreat further and revisit the 1.0630 region as the US session draws to a close.
GBP/USD stays firm amid BoE, Fed commentary and US data

GBP/USD edges lower in the second half of the day and trades at around 1.2450. Better-than-expected Jobless Claims and Philadelphia Fed Manufacturing Index data from the US provides a support to the USD and forces the pair to stay on the back foot.
Gold is closely monitoring geopolitics

Gold trades in positive territory above $2,380 on Thursday. Although the benchmark 10-year US Treasury bond yield holds steady following upbeat US data, XAU/USD continues to stretch higher on growing fears over a deepening conflict in the Middle East.
Ripple faces significant correction as former SEC litigator says lawsuit could make it to Supreme Court

Ripple (XRP) price hovers below the key $0.50 level on Thursday after failing at another attempt to break and close above the resistance for the fourth day in a row.
Have we seen the extent of the Fed rate repricing?

Markets have been mostly consolidating recent moves into Thursday. We’ve seen some profit taking on Dollar longs and renewed demand for US equities into the dip. Whether or not this holds up is a completely different story.
