EUR/USD Current price: 1.1131
View Live Chart for the EUR/USD
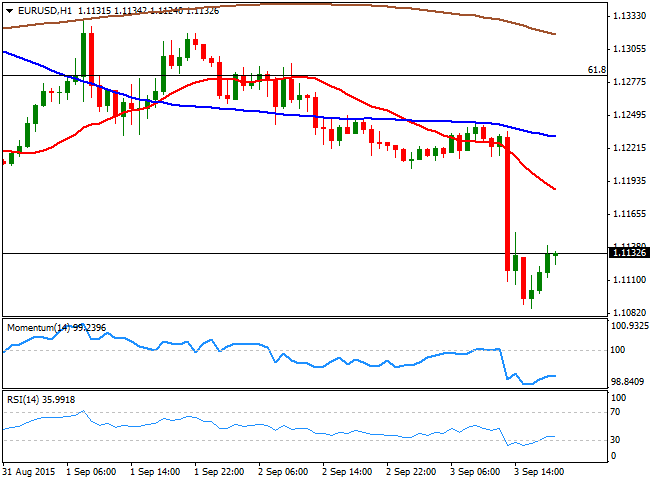
The EUR/USD pair fell to its lowest level in two weeks, reaching 1.1086 before finally bouncing as investors are adjusting positions ahead of the US employment report to be released this Friday. The EUR sunk following the latest ECB economic policy statement, in which Mario Draghi expressed officers' concerns over the economic slowdown that affects emerging countries and China. Additionally, the ECB stuff downgraded its forecast for growth and inflation, and increased the issue share limit to 33% from previous 25%. Somehow, the ECB has let investors known that QE is not working as well as he previously announced. In the US however, news were mostly positive, with the US trade deficit shrinking to its smallest in five months, in July, down to $41.9B, while the ISM non-manufacturing PMI resulted at 59.0 in August, below previous 60.3, but above expectations of 58.1.
The pair is ending the day around 1.1130, and will likely trade in quite a limited range during the Asian session, as Chinese market will remain closed on holidays until next Monday. Technically, the 1 hour chart shows that the technical indicators have corrected the extreme oversold readings reached intraday, but have lost their upward strength well below their mid-lines. In the 4 hours chart, the technical readings also favor the downside, with the technical indicators barely recovering from oversold levels, and well below its 20 SMA. The upcoming move will depend solely on the NFP result and how the market takes it, with a break below 1.1050 most likely confirming another day of gains for the USD.
Support levels: 1.1080 1.1050 1.1010
Resistance levels: 1.1160 1.1200 1.1245
EUR/JPY Current Price: 133.50
View Live Chart for the EUR/JPY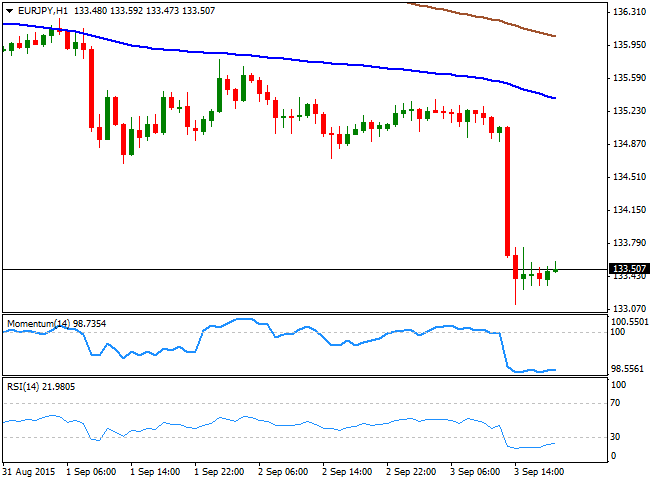
The EUR/JPY plummeted to 133.12, its lowest level in four months, amid EUR's sell-off, and remains nearby by US close, unable to recover beyond 133.74, the US session high. The Japanese yen traded generally higher across the board, as sellers are on hold ahead of the upcoming US Nonfarm Payroll report, usually a big market mover for the Japanese currency. As for the EUR/JPY short term technical picture, the 1 hour chart shows that the technical indicators hold in extreme oversold levels, whilst the price is far below its moving averages, all of which maintains the risk towards the downside. In the 4 hours chart, the RSI is bouncing around 25, still far from suggesting an upcoming upward corrective movement, whilst the Momentum indicator has also lost its bearish strength, but stands well into the red.
Support levels: 133.10 132.70 132.40
Resistance levels: 133.75 134.10 134.60
GBP/USD Current price: 1.5257
View Live Chart for the GPB/USD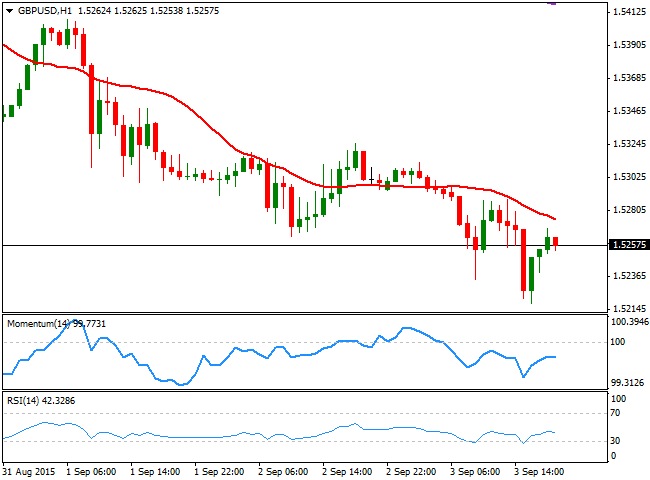
The GBP/USD pair reached a lower low for the week, reaching 1.5218, a level not seen since early June. Earlier in the European morning, the UK Services PMI fell down to 55.6 in August, from 57.4 in July, the lowest level in over two years, adding to the batch of tepid data coming from Britain these past weeks. The pair saw little intraday activity, confined within the 1.5200 region. Technically, the downside is still favored, despite the almost 600 pips straight decline, as in the 1 hour chart, the price develops below a mild bearish 20 SMA, whilst the technical indicators are turning south below their mid-lines. In the 4 hours chart the 20 SMA continues to be the main intraday resistance, heading strongly lower now around 1.5320, whilst the RSI indicator is barely bouncing from oversold levels, around 35, and the Momentum indicator is also standing below its mid-line. The risk of an upward corrective movement increases ahead of the weekend, yet a strong US employment report should see the pair breaking lower, with the next immediate bearish target at 1.5170.
Support levels: 1.5250 1.5220 1.5170
Resistance levels: 1.5290 1.5330 1.5360
USD/JPY Current price: 119.97
View Live Chart for the USD/JPY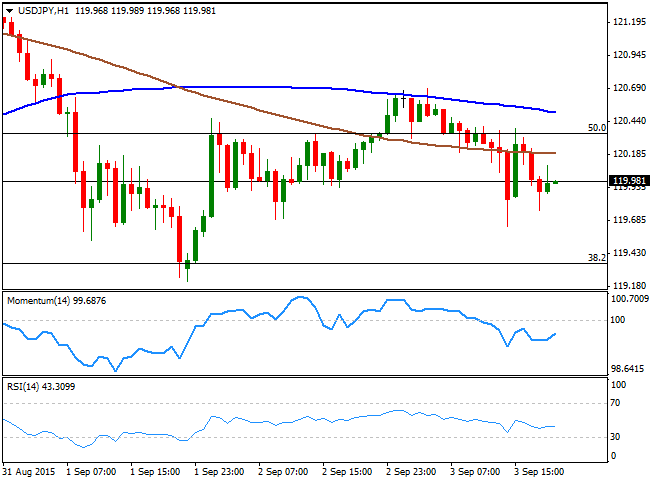
The USD/JPY pair erased most of its Wednesday's gains, closing the day just below the 120.00 figure. The Japanese yen advanced, despite the strong upward momentum in European and American stocks, as the EUR/JPY sold-off with the ECB, spurring yen´s intraday demand. The USD/JPY bounced back up to the 120.35 region following positive US data, finding short term selling interest around the 50% retracement of the last two weeks decline. The technical picture still favors the downside, as the 1 hour chart shows that the price is well below its moving averages, whilst the technical indicators have lost their downward strength, but remain below their mid-lines. In the 4 hours chart, the Momentum indicator holds around the 100 level while the RSI aims slightly higher around 41 and the moving averages maintain their bearish slopes well above the current price. The pair may reverse course with a strong US employment reading, and advance up to 121.00 the 200 DMA.
Support levels: 119.40 118.90 118.50
Resistance levels: 120.00 120.35 120.60
AUD/USD Current price: 0.7013
View Live Chart for the AUD/USD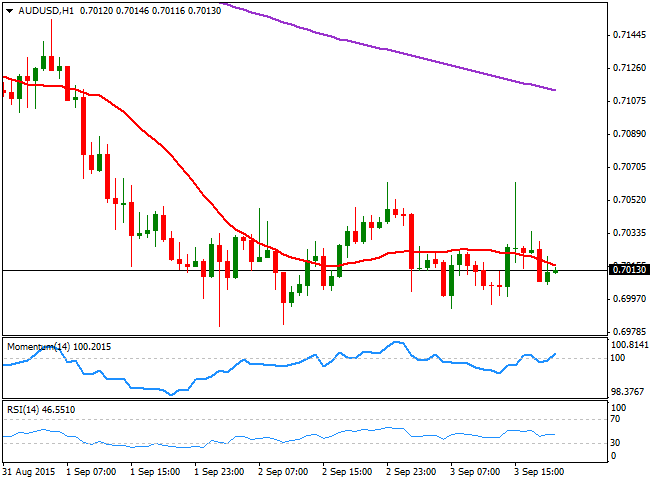
The AUD/USD pair was quite choppy this Thursday, ending the day in the red after advancing up to 0.7062 intraday, following stocks in their way higher at the US opening. Nevertheless, positive US data finally won the battle and the pair quickly reverted its gains. Also, the sharp intraday decline, is a clear sign of sellers waiting for higher levels to add. Technically, the 1 hour chart shows that the price is below a bearish 20 SMA, whilst the technical indicators hover around their mid-lines, unable to clearly determinate a certain directional strength. In the 4 hours chart, the 20 SMA maintains its strong bearish slope around 0.7040, now the immediate intraday resistance, whilst the RSI indicator hovers around 38 and the Momentum indicator aims higher below the 100 level, limiting chances of a stronger advance.
Support levels: 0.6980 0.6950 0.6915
Resistance levels: 0.7040 0.7070 0.7100
Recommended Content
Editors’ Picks
EUR/USD clings to daily gains above 1.0650

EUR/USD gained traction and turned positive on the day above 1.0650. The improvement seen in risk mood following the earlier flight to safety weighs on the US Dollar ahead of the weekend and helps the pair push higher.
GBP/USD recovers toward 1.2450 after UK Retail Sales data

GBP/USD reversed its direction and advanced to the 1.2450 area after touching a fresh multi-month low below 1.2400 in the Asian session. The positive shift seen in risk mood on easing fears over a deepening Iran-Israel conflict supports the pair.
Gold holds steady at around $2,380 following earlier spike

Gold stabilized near $2,380 after spiking above $2,400 with the immediate reaction to reports of Israel striking Iran. Meanwhile, the pullback seen in the US Treasury bond yields helps XAU/USD hold its ground.
Bitcoin Weekly Forecast: BTC post-halving rally could be partially priced in Premium

Bitcoin price shows no signs of directional bias while it holds above $60,000. The fourth BTC halving is partially priced in, according to Deutsche Bank’s research.
Week ahead – US GDP and BoJ decision on top of next week’s agenda

US GDP, core PCE and PMIs the next tests for the Dollar. Investors await BoJ for guidance about next rate hike. EU and UK PMIs, as well as Australian CPIs also on tap.