EUR/USD Current price: 1.1232
View Live Chart for the EUR/USD

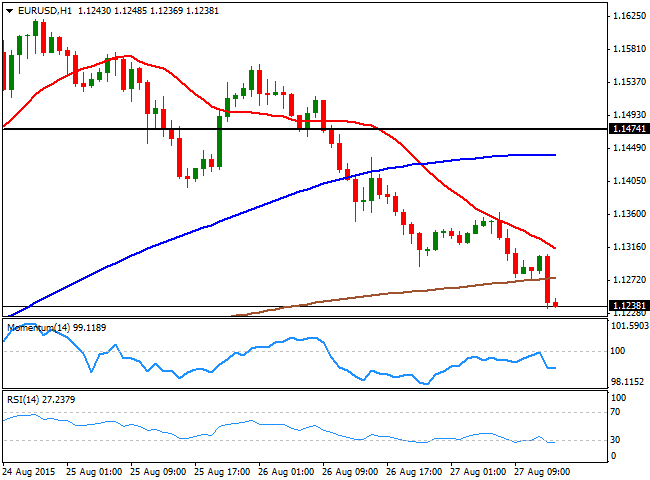
The EUR/USD pair extended its decline and quotes at the lowest of the week after the release of much better-than-expected advanced GDP readings for the second quarter. The US has grown 3.7% according to the preliminary figures, surpassing expectations of 3.2%. Also, weekly unemployment claims for the week ending August 22 printed 271, better than the 274K expected. The EUR/USD 1 hour chart shows that the price holds near the lows, and below its moving averages, whilst the technical indicators remain flat in oversold levels. In the 4 hours chart, the price is well below a bearish 20 SMA, whilst the technical indicators head lower near oversold territory, maintaining the risk towards the downside.
Support levels: 1.1220 1.1185 1.1150
Resistance levels: 1.1260 1.1300 1.1345
GBP/USD Current price: 1.5418
View Live Chart for the GPB/USD
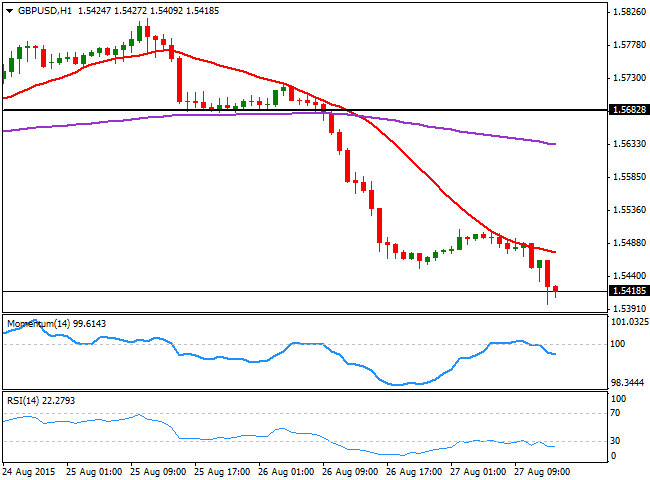
The GBP/USD extended its decline down to 1.5399, maintaining a strong negative tone and with the 1 hour chart showing that the price was unable to advance beyond its 20 SMA, currently offering a strong dynamic resistance around 1.5460, while the RSI indicator heads lower around 20, and the Momentum indicator retreats from its 100 level. In the 4 hours chart the technical readings are in extreme oversold levels, but also maintaining their sharp bearish slopes, supporting additional declines for the upcoming hours.
Support levels: 1.5370 1.5335 1.5290
Resistance levels: 1.5425 1.5460 1.5500
USD/JPY Current price: 120.55
View Live Chart for the USD/JPY
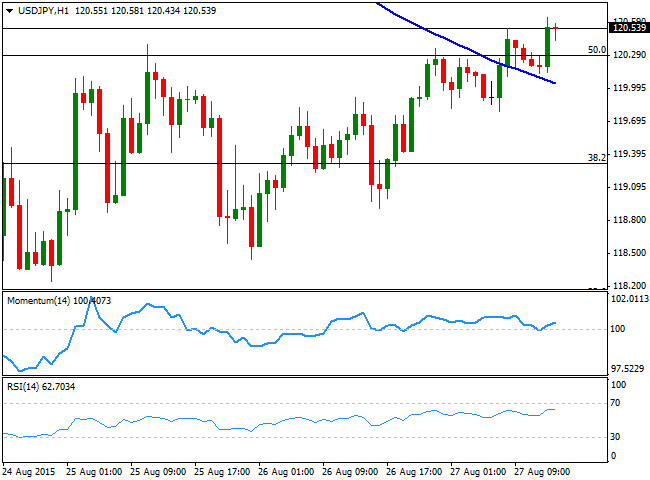
The USD/JPY advanced just a few pips above its former daily high and reached 120.63 with the news, a really shallow advanced taking into account the positive surprise triggered by US GDP data. The 1 hour chart shows that the price is now above its 100 SMA, and above the 50% retracement of these last two weeks decline around 120.30, the immediate support. In the same chart, the technical indicators head higher above their mid-lines, but lack upward momentum. In the 4 hours chart, the upside seems a bit more constructive, with the immediate bullish target at 121.00 the 100 DMA, followed by 121.35, the 61.8% retracement of the same rally.
Support levels: 120.30 119.90 119.60
Resistance levels: 121.00 121.35 121.70
AUD/USD Current price: 0.7131
View Live Chart for the AUD/USD
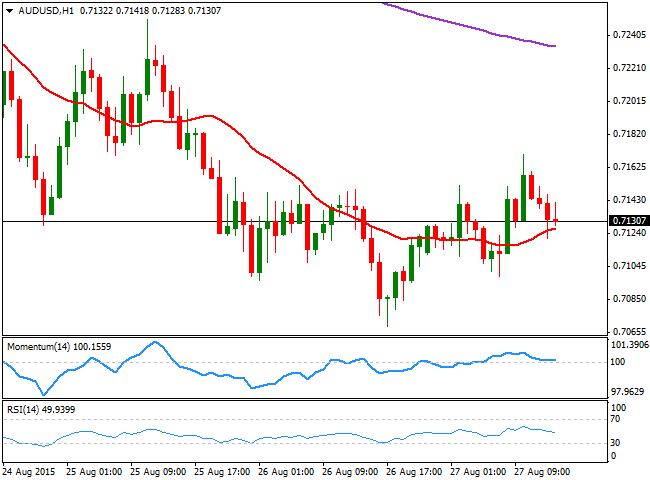
The AUD/USD eases from a daily high of 0.7170, trading a few pips above its daily opening, pretty much flat on the day. The short term technical picture shows that in the 1 hour chart, the price is a couple of pips above a bullish 20 SMA, whilst the technical indicators hover around their mid-lines, lacking clear directional strength. In the 4 hours chart the upside was limited by a still bearish 20 SMA ever since the day started, whilst the RSI indicator resumes its decline near 41, maintaining the risk towards the downside.
Support levels: 0.7110 0.7070 0.7030
Resistance levels: 0.7145 0.7190 0.7240
Recommended Content
Editors’ Picks
EUR/USD clings to daily gains above 1.0650

EUR/USD gained traction and turned positive on the day above 1.0650. The improvement seen in risk mood following the earlier flight to safety weighs on the US Dollar ahead of the weekend and helps the pair push higher.
GBP/USD recovers toward 1.2450 after UK Retail Sales data

GBP/USD reversed its direction and advanced to the 1.2450 area after touching a fresh multi-month low below 1.2400 in the Asian session. The positive shift seen in risk mood on easing fears over a deepening Iran-Israel conflict supports the pair.
Gold holds steady at around $2,380 following earlier spike

Gold stabilized near $2,380 after spiking above $2,400 with the immediate reaction to reports of Israel striking Iran. Meanwhile, the pullback seen in the US Treasury bond yields helps XAU/USD hold its ground.
Bitcoin Weekly Forecast: BTC post-halving rally could be partially priced in Premium

Bitcoin price shows no signs of directional bias while it holds above $60,000. The fourth BTC halving is partially priced in, according to Deutsche Bank’s research.
Week ahead – US GDP and BoJ decision on top of next week’s agenda

US GDP, core PCE and PMIs the next tests for the Dollar. Investors await BoJ for guidance about next rate hike. EU and UK PMIs, as well as Australian CPIs also on tap.