EUR/USD Current price: 1.1071
View Live Chart for the EUR/USD

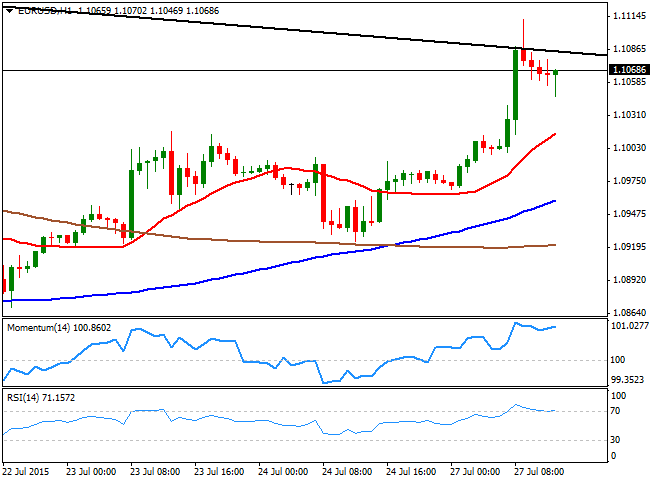
The EUR/USD pair surged to a daily high of 1.1103 on the back of positive European data, with the German IFO survey showing that confidence among local investors rose beyond expected, on diminishing risk of a Grexit, and a rise in circulating in the EU region. The pair however, retreated from its high, and consolidated above the 1.1050 level, ahead of the release of the US Durable Goods Orders. The key market mover resulted better-than-expected, printing 3.4% in June against expectations of a 3.0% advance. The core reading also came out above expectations, advancing 0.8%. The reading is far from supporting the greenback however, as the EUR/USD pair bounced quickly from a short lived kneejerk, maintaining its overall positive tone. Technically, the pair is still biased higher in the short term, as the price continues to develop well above its moving averages, whilst the Momentum indicator heads slightly higher near overbought levels, as the RSI indicator hovers around 70. In the 4 hours chart, the price has retreated from a roof of a daily descendant channel, whilst the technical indicators are beginning to give signs of upward exhaustion, although remain far from suggesting a bearish move. At this point however, the price needs to extend beyond 1.1120 to confirm additional intraday gains towards the 1.1200 level.
Support levels: 1.1050 1.1000 1.0960
Resistance levels: 1.1090 1.1120 1.1160
GBP/USD Current price: 1.5535
View Live Chart for the GPB/USD
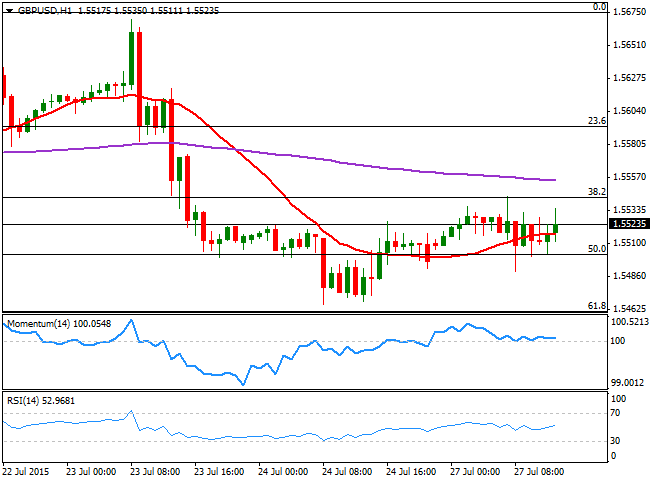
The GBP/USD pair advanced up to 1.5543 this Monday, helped by dollar's broad weakness. The pair however, was unable to extend beyond the 38.2% retracement of its latest bullish run that converges with the mentioned high. The pair however, is holding above the 1.5500 level, 50% retracement of the same rally, with a brief decline below it quickly attracting buying interest. Short term, the outlook is neutral-to-bullish as the price hovers above a mil bullish 20 SMA whilst the technical indicators barely head higher above their mid-lines in the 1 hour chart. In the 4 hours one, the price remains below a bearish 20 SMA that also converges with the daily high, whilst the technical indicators aim higher, but below their mid-lines, limiting chances of a stronger advance.
Support levels: 1.5460 1.5420 1.5385
Resistance levels: 1.5545 1.5590 1.5635
USD/JPY Current price: 123.17
View Live Chart for the USD/JPY
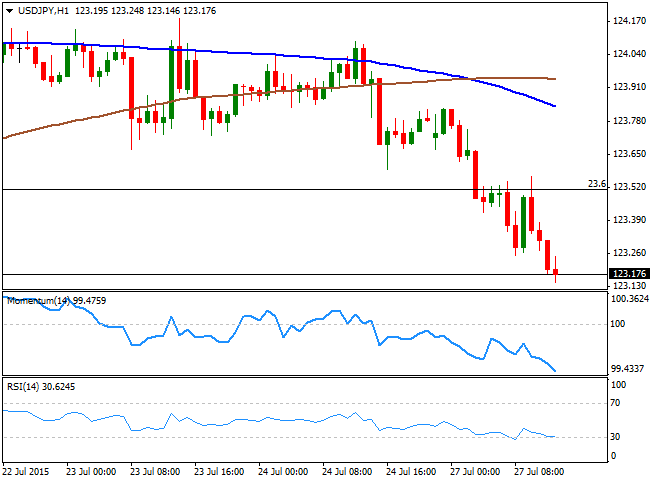
Bearish potential towards 122.40. The USD/JPY pair fell to a fresh 2-week low, as the yen got a boost during Asian hours, from a sell-off in local share markets. Chinese shares fell 8.5% whilst the Nikkei extended its decline down to a 2-week low near 20,100. The USD/JPY pair trades around its daily low, with a spike up to 123.30, following US positive Durable Goods Orders data, attracting selling interest. The bias is south as the 1 hour chart shows that the price has extended well below its moving averages, with the 100 SMA crossing below the 200 SMA and with the technical indicators heading strongly lower, despite being near oversold territory. In the 4 hours chart, the price is now around its moving averages that converge flat a few pips above the current level, whilst the technical indicators head lower below their mid-lines. The immediate support comes at 122.90, the 38.2% retracement of its latest bullish run, with a break below it confirming additional declines towards 122.40, the 50% retracement of the same rally.
Support levels: 122.90 122.40 122.00
Resistance levels: 123.30 123.70 124.20
AUD/USD Current price: 0.7293
View Live Chart for the AUD/USD
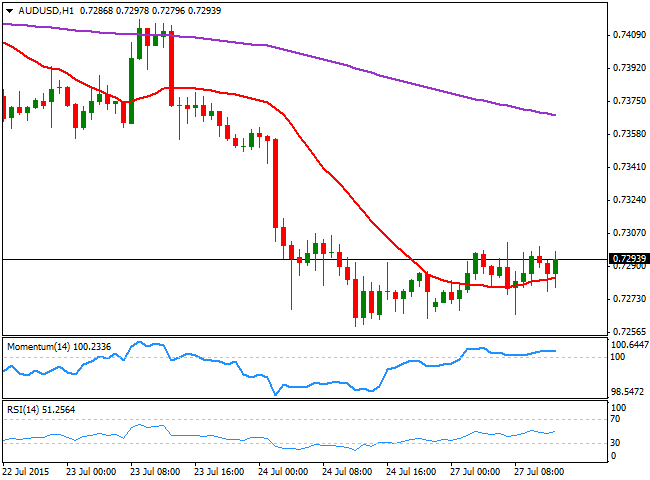
The AUD/USD pair trades in a limited intraday range, having recovered some ground amid dollar's weakness, but unable to extend beyond the 0.7310 level the immediate intraday resistance. The short term picture suggest the downside is limited, as the 1 hour chart shows that the price is now above a mild bullish 20 SMA, whilst the technical indicators post shallow advances above their mid-lines. In the 4 hours chart, however, the bearish potential remains intact with the 20 SMA heading sharply lower around 0.7320 and the technical indicators maintaining their bearish slopes.
Support levels: 0.7260 0.7225 0.7185
Resistance levels: 0.7310 0.7345 0.7390
Recommended Content
Editors’ Picks
EUR/USD hovers around 1.0700 after German IFO data

EUR/USD stays in a consolidation phase at around 1.0700 in the European session on Wednesday. Upbeat IFO sentiment data from Germany helps the Euro hold its ground as market focus shifts to US Durable Goods Orders data.
USD/JPY refreshes 34-year high, attacks 155.00 as intervention risks loom

USD/JPY is renewing a multi-decade high, closing in on 155.00. Traders turn cautious on heightened risks of Japan's FX intervention. Broad US Dollar rebound aids the upside in the major. US Durable Goods data are next on tap.
Gold price trades with mild negative bias, manages to hold above $2,300 ahead of US data

Gold price (XAU/USD) edges lower during the early European session on Wednesday, albeit manages to hold its neck above the $2,300 mark and over a two-week low touched the previous day.
Worldcoin looks set for comeback despite Nvidia’s 22% crash Premium

Worldcoin price is in a better position than last week's and shows signs of a potential comeback. This development occurs amid the sharp decline in the valuation of the popular GPU manufacturer Nvidia.
Three fundamentals for the week: US GDP, BoJ and the Fed's favorite inflation gauge stand out Premium

While it is hard to predict when geopolitical news erupts, the level of tension is lower – allowing for key data to have its say. This week's US figures are set to shape the Federal Reserve's decision next week – and the Bank of Japan may struggle to halt the Yen's deterioration.