EUR/USD Current price: 1.0983
View Live Chart for the EUR/USD
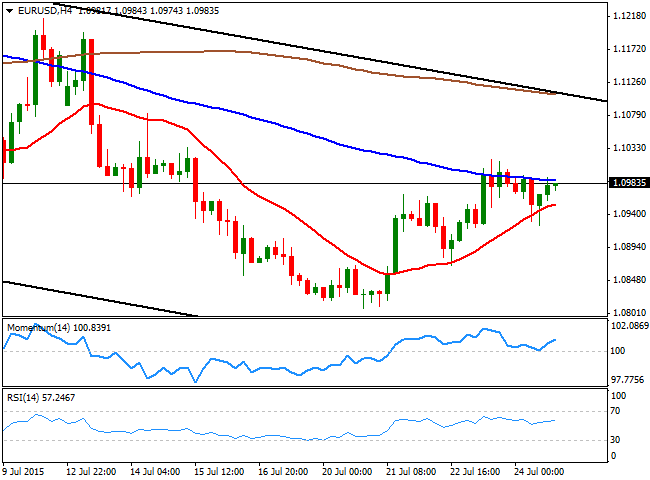
The American dollar closed the day mixed last week, with the EUR among the few posting gains against the greenback. The EUR/USD pair managed to advance on Friday, after US New Home sales slipped to the lowest level of this 2015, falling 6.8% to a 482K annualized pace. The fundamental picture however, was far from favoring EUR's gains, as local PMI figures missed expectations, with France´s private sector output growth easing to a three-month low in July. In the US however, the manufacturing sector improved in July with the local PMI up to 53.8 against previous 53.6, an almost 2-year low. The upcoming week will have a pretty busy calendar with all eyes on the FOMC monetary economic policy meeting, supposedly the latest before the Central Bank begins its tightening policy. Also, investors will be watching Greece, as bailout talks are expected to begin sometime these days.
The EUR/USD pair is developing within a daily descendant channel coming from June high at 1.1435 with the roof currently around 1.1050/80 for the upcoming days, which means that unless the pair advances beyond these levels, the upward movements are mostly seen as corrective. Daily basis, the bearish potential is intact as the pair remains below its 20 SMA, whilst the technical indicators are resuming the downside after failing around their mid-lines. In the 4 hours chart, however, the price is holding above a bullish 20 SMA around 1.0950, whilst the Momentum indicator heads higher above the 100 level, all of which should keep the downside limited in the short term. At this point, the pair needs to accelerate below the support at 1.0910 to confirm a new leg lower towards the 1.0860 region.
Support levels: 1.0950 1.0910 1.0860
Resistance levels: 1.1000 1.1045 1.1080
EUR/JPY Current Price: 135.84
View Live Chart for the EUR/JPY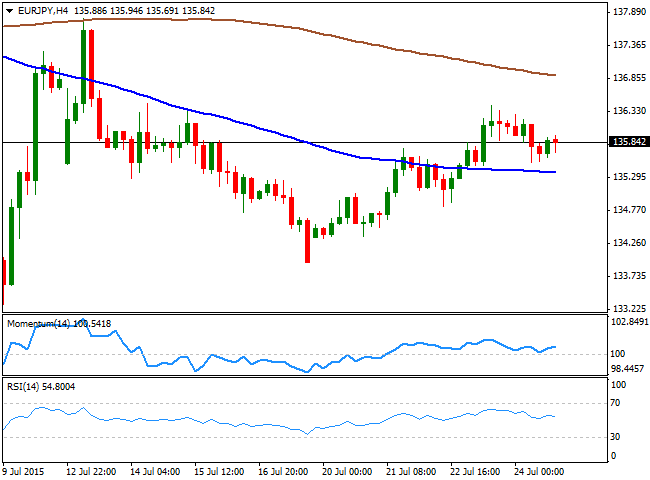
The EUR/JPY continues trading in quite a restricted range, having remained between 134.00/136.00 this past week. The long term picture has turned neutral, given the fact that in the weekly chart the pair has been trading within the mentioned range for almost 2 months, with movements outside the range being short lived. BOJ's Governor Kuroda has diminished chances of further easing in Japan, and even claimed the 2% inflation target may be achieved in the first half of 2016, which may result in some strength of the JPY particularly against weaker currencies such as the EUR or the ones related to commodities. In the meantime, the daily chart shows that the price is hovering around its 200 SMA, whilst the 100 SMA stands around 134.40 providing a strong support in the case of a retracement. The Momentum indicator in the mentioned chart heads higher in positive territory, albeit at this point, the pair needs to establish above the 137.00 to gather enough demand to continue rallying. In the 4 hours chart, the technical picture is neutral-to-bullish, as the technical indicators hold above their mid-lines, but lacking directional strength.
Support levels: 135.40 134.90 134.40
Resistance levels: 136.20 136.80 137.35
GBP/USD Current price: 1.5496
View Live Chart for the GPB/USD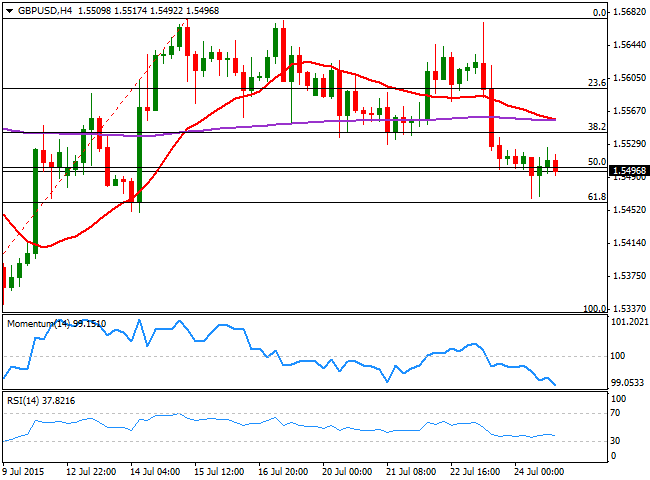
The GBP/USD pair closed last week near the 2-week low of 1.5450 posted on July 14th, despite sentiment towards the Pound has become increasingly bullish after different members of the MPC signaled the time for a rate hike is getting closer. The British currency got a hit of Thursday as local Retail Sales unexpectedly dropped, extending its decline on Friday down to the 61.8% retracement of its latest bullish run between 1.5329 and 1.5674, at 1.5460. The daily chart shows that the price is now below a bearish 20 SMA, whilst the RSI indicator has already turned south below its mid-line, keeping the risk towards the downside. Shorter term, the 4 hours chart shows that the pair has accelerated south after breaking below its 200 EMA, and now develops also below a mild bearish 20 SMA, whilst the technical indicators head south near oversold territory, supporting the longer term view. A break below the 1.5450/60 price zone however, is required to confirm a new bearish run towards 1.5329 where the pair will complete a full 100% retracement.
Support levels: 1.5460 1.5420 1.5385
Resistance levels: 1.5545 1.5590 1.5635
USD/JPY Current price: 123.78
View Live Chart for the USD/JPY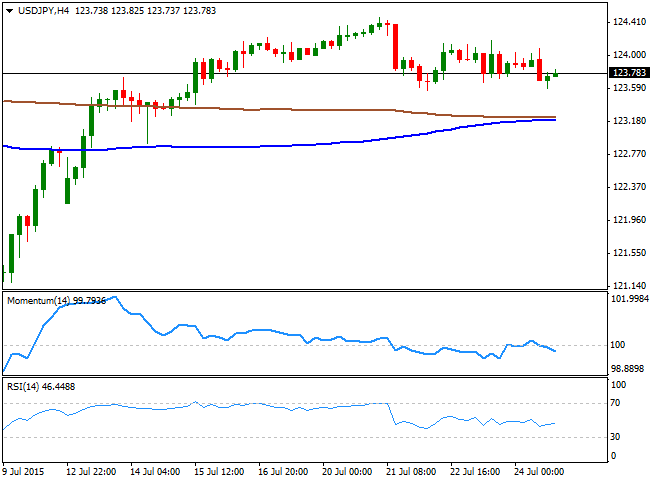
The USD/JPY pair was confined to a 100 pips range last week, unable to advance beyond the 124.00 figure, but holding nearby and finding buying interest on approaches to the 123.30 support. The upcoming FOMC meeting in the US, could well be the trigger the pair needs to set a more directional tone, as if the Central Bank increases hopes of a September rate hike, the pair may get an unexpected boost towards its highs beyond 125.00. A dovish US FED however, should lead to a stronger bearish move, down to 122.40, the 50% retracement of the latest bullish run in the pair. Technically, the daily chart shows that the price holds well above its moving averages, whilst the Momentum indicator heads north above the 100 SMA and the RSI indicator consolidates around 54, all of which should continue keeping the downside limited. In the 4 hours chart however, the technical indicators present a mild negative tone, as their holding below their mid-lines. Nevertheless and due to the recent restricted range, intraday indicators lack directional strength. At this point the pair needs to extend beyond 124.45 to confirm a new leg higher towards the 125.00 region.
Support levels: 123.30 122.90 122.40
Resistance levels: 124.20 124.45 124.90
AUD/USD Current price: 0.7277
View Live Chart for the AUD/USD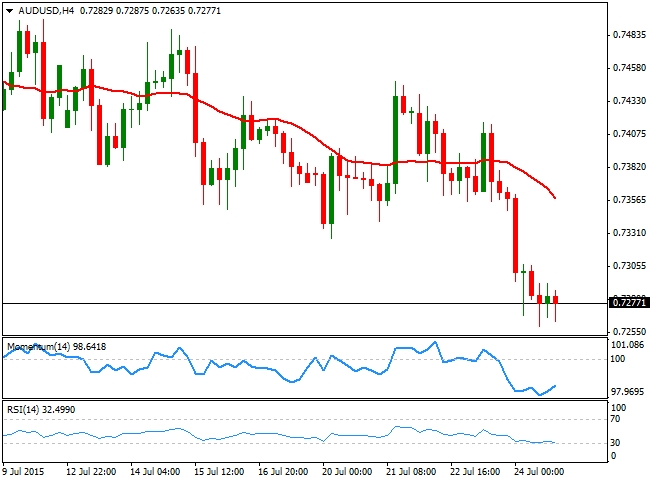
The AUD/USD pair sunk to its lowest level in over six years last week of 0.7259, ending it a few pips above it, and maintaining an overall negative tone. Commodity currencies suffered the most against the greenback as oil and gold traded sharply lower on speculation the US Federal Reserve will raise its main benchmark as soon as next September. Additionally, the RBA has maintained an accommodative stance, leaving the doors open for another rate cut this year. In the daily chat, the 20 SMA has fallen sharply alongside with the price, and now offers a strong dynamic resistance around the 0.7400 figure, whilst the technical indicators present strong bearish slopes below their mid-lines, all of which supports further declines. In the 4 hours chart, the 20 SMA also accelerated south above the current price, whilst the RSI indicator hovers around 32 and the Momentum indicator aims slightly higher well below the 100 level, in line with the longer term outlook.
Support levels: 0.7260 0.7225 0.7185
Resistance levels: 0.7310 0.7345 0.7390
Recommended Content
Editors’ Picks
EUR/USD clings to daily gains above 1.0650

EUR/USD gained traction and turned positive on the day above 1.0650. The improvement seen in risk mood following the earlier flight to safety weighs on the US Dollar ahead of the weekend and helps the pair push higher.
GBP/USD recovers toward 1.2450 after UK Retail Sales data

GBP/USD reversed its direction and advanced to the 1.2450 area after touching a fresh multi-month low below 1.2400 in the Asian session. The positive shift seen in risk mood on easing fears over a deepening Iran-Israel conflict supports the pair.
Gold holds steady at around $2,380 following earlier spike

Gold stabilized near $2,380 after spiking above $2,400 with the immediate reaction to reports of Israel striking Iran. Meanwhile, the pullback seen in the US Treasury bond yields helps XAU/USD hold its ground.
Bitcoin Weekly Forecast: BTC post-halving rally could be partially priced in Premium

Bitcoin price shows no signs of directional bias while it holds above $60,000. The fourth BTC halving is partially priced in, according to Deutsche Bank’s research.
Week ahead – US GDP and BoJ decision on top of next week’s agenda

US GDP, core PCE and PMIs the next tests for the Dollar. Investors await BoJ for guidance about next rate hike. EU and UK PMIs, as well as Australian CPIs also on tap.