EUR/USD Current price: 1.1132
View Live Chart for the EUR/USD
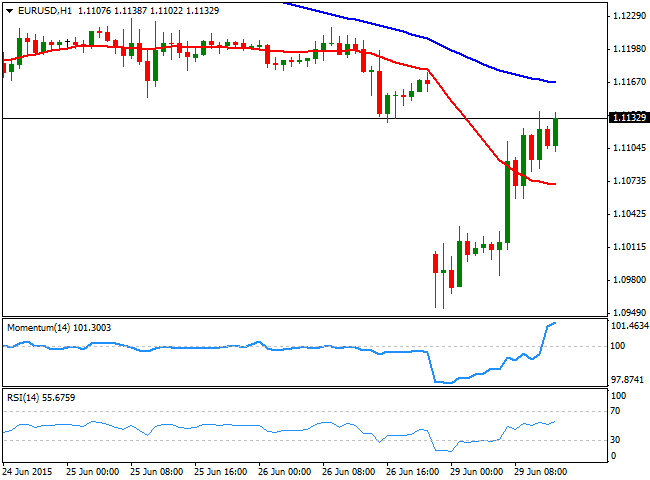
The EUR/USD pair recovered most of its early day losses, trading above the 1.1100 figure ahead of the US opening, having almost filled the weekly opening gap. A Grexit became real over the weekend, triggering risk-adverse trading in the forex market: the Japanese Yen and the Swiss Franc were on demand, but the latest reverted temporarily its gains as the SNB intervene the market to prevent Swissy strength. Nevertheless, both the EUR and the CHF continue advancing against the greenback, with the EUR/USD pair trading near its daily high. The short term technical picture favors the upside, as the price has extended above its 20 SMA whilst the technical indicators aim higher near overbought levels. In the 4 hours chart, the 20 SMA caps the upside around 1.1160, whilst the technical indicators have corrected extreme oversold readings, and are now turning slightly lower in negative territory, suggesting further advances will likely remain limited.
Support levels: 1.1090 1.1050 1.1010
Resistance levels: 1.1160 1.1200 1.1245
GBP/USD Current price: 1.5719
View Live Chart for the GBP/USD
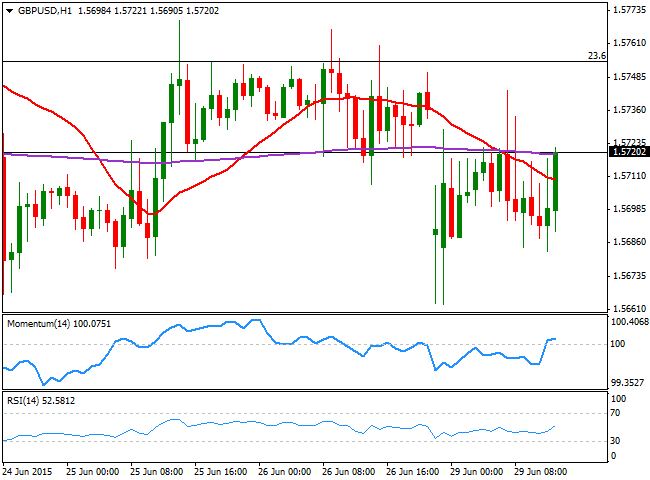
The GBP/USD pair maintains the neutral technical stance seen over the last days, having recovered from a daily low of 1.5663. The 1 hour chart shows that the price is holding mid-way in between Fibonacci levels, with the 23.6% retracement of the latest bullish run providing resistance at 1.5750 and the 38.2% retracement of the same rally acting as support at 1.5645. In the 1 hour chart, the technical indicators have advanced above their mid-lines but lost the upward potential afterwards, whilst the price continues to hover around a mild bearish 20 SMA. In the 4 hours chart, the price stands around its 20 SMA whilst the Momentum indicator remains stuck around the 100 level, and the RSI indicator aims higher in negative territory.
Support levels: 1.5695 1.5645 1.5610
Resistance levels: 1.5750 1.5795 1.5830
USD/JPY Current price: 122.75
View Live Chart for the USD/JPY
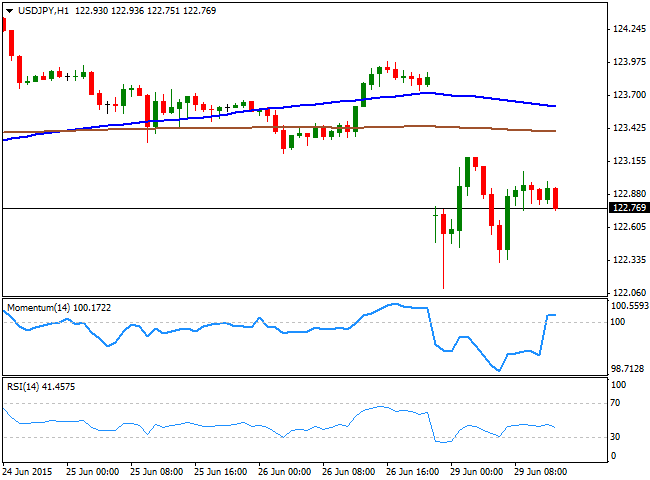
The USD/JPY pair is resuming its decline with the yen still on demand against all of its rivals. The Japanese currency has advanced sharply during the Asian session, gapping higher , and with those gaps still unfilled. As for the USD/JPY technical picture, the 1 hour chart shows that the latest price recovery stalled well below the 100 and 200 SMAs, whilst the Momentum indicator is losing its upward strength after crossing above the 100 level, and the RSI indicator maintains its bearish slope around 41. In the 4 hours chart, the price was unable to advance above its 200 SMA, whilst the technical indicators maintain their bearish strength in negative territory, maintaining the risk towards the downside particularly on a break below 122.45, the immediate support.
Support levels: 122.45 122.00 121.60
Resistance levels: 123.30 123.75 124.10
AUD/USD Current price: 0.7665
View Live Chart for the AUD/USD
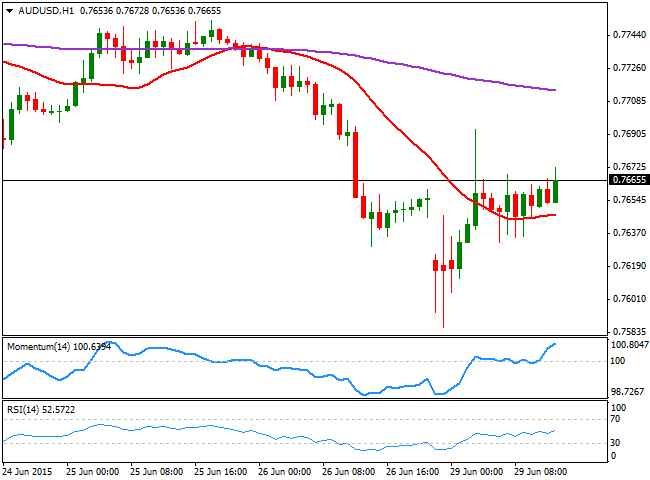
The AUD/USD pair has surged on the back of the People's Bank of China decision to cut rates on Saturday, neutralizing the effect of the Greek news in the antipodean currency. The pair fell down to 0.7583 before recovering, and maintains a bullish short term tone, as the 1 hour chart shows that the price has stabilized above its 20 SMA, now around 0.764, whilst the technical indicators maintain their tepid bullish slopes above their mid-lines. In the 4 hours chart however, the price remains below a strongly bearish 20 SMA whilst the technical indicators head lower below their mid-lines, limiting chances of a stronger advance during the upcoming hours.
Support levels: 0.7640 0.7590 0.7555
Resistance levels: 0.7685 0.7720 07755
Recommended Content
Editors’ Picks
EUR/USD climbs to 10-day highs above 1.0700

EUR/USD gained traction and rose to its highest level in over a week above 1.0700 in the American session on Tuesday. The renewed US Dollar weakness following the disappointing PMI data helps the pair stretch higher.
GBP/USD extends recovery beyond 1.2400 on broad USD weakness

GBP/USD gathered bullish momentum and extended its daily rebound toward 1.2450 in the second half of the day. The US Dollar came under heavy selling pressure after weaker-than-forecast PMI data and fueled the pair's rally.
Gold rebounds to $2,320 as US yields turn south

Gold reversed its direction and rose to the $2,320 area, erasing a large portion of its daily losses in the process. The benchmark 10-year US Treasury bond yield stays in the red below 4.6% following the weak US PMI data and supports XAU/USD.
Here’s why Ondo price hit new ATH amid bearish market outlook Premium

Ondo price shows no signs of slowing down after setting up an all-time high (ATH) at $1.05 on March 31. This development is likely to be followed by a correction and ATH but not necessarily in that order.
Germany’s economic come back

Germany is the sick man of Europe no more. Thanks to its service sector, it now appears that it will exit recession, and the economic future could be bright. The PMI data for April surprised on the upside for Germany, led by the service sector.


