EUR/USD Current price: 1.1150
View Live Chart for the EUR/USD
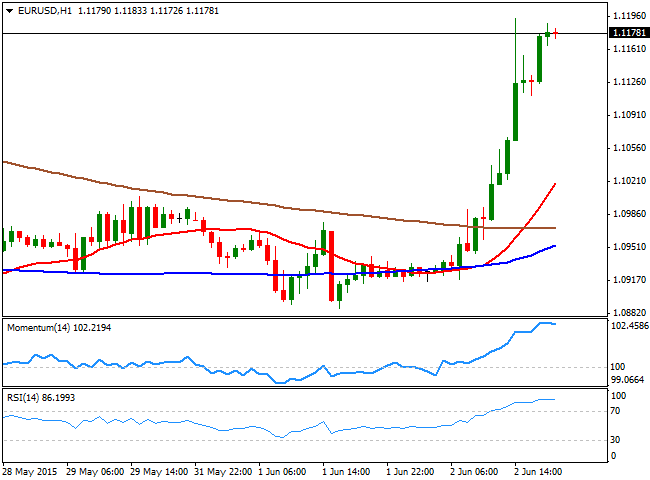
The common currency soared on Tuesday, adding over two full cents against the greenback, with no clear catalyst behind the movement, other than German bund yields surging and hopes of an imminent deal between Greece and its creditors. Early in the European session, German unemployment declined for an eighth month in May, whilst the EU yearly inflation figures for May have shown an increase of 0.3%. Underlying inflation, excluding food and energy, rose 0.9% from the record low of 0.6% printed in April. The positive macroeconomic figures came alongside with hopes of a Greek deal, as both, the troubled country and its creditors, submitted proposals to each other today, and announced they hope a deal may be reached before the week is over.
The EUR/USD pair broke through the 1.1050 strong static resistance, and accelerated its advance up to the 1.1120 critical level, blasting stops and fueling the rally that extended up to 1.1193 before finally stalling. Tepid US data and a nose-diving US Dollar Index, which fell down to 95.67 weighted on the greenback that slid all across the board. Mid American afternoon, EU group commission's President Jeroen Dijsselbloem, cooled down hopes on Greece, stating a deal is still far, but the market ignored him, maintaining its dollar-bearish stance. As for the technical picture, the 1 hour chart shows that the pair is extremely overbought, with indicators beginning to look exhausted, but far from suggesting a downward correction ahead. In the 4 hours chart the technical indicators maintain their bullish slopes, despite being in overbought territory, whilst the price advanced beyond its moving averages, all of which should keep the downside the limited. The ECB is having is monthly economic meeting this Wednesday, and upcoming EUR direction will depend on Draghi's speech and the developments of Athens' negotiations with its creditors.
Support levels: 1.1120 1.1050 1.1000
Resistance levels: 1.1200 1.1245 1.1290
EUR/JPY Current price: 138.40
View Live Chart for the EUR/JPY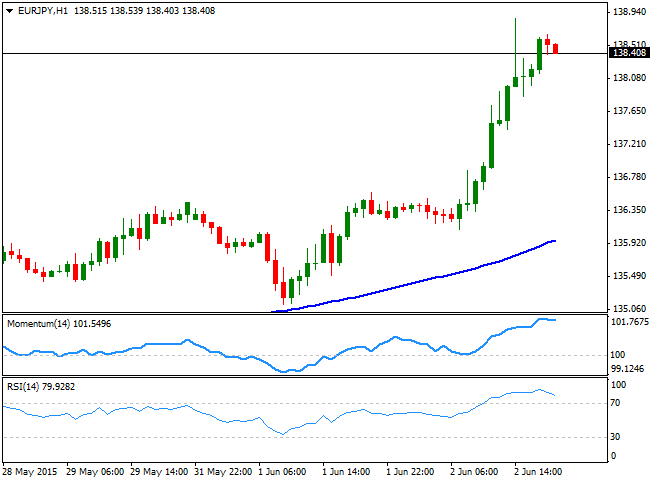
The EUR/JPY cross advanced up to a fresh 5-month high of 138.85 on the back of EUR strength, taking out some large stops around the 138.00 level, where the pair has found buyers on pullbacks. The sharp advance has left short term indicators in extreme overbought territory, with the 1 hour chart showing both, the RSI and the Momentum indicators turning lower but far from suggesting a downward corrective movement underway, whilst the price has moved far away from its moving averages, now irrelevant in the short term. In the 4 hours chart the price extended further above its 100 SMA after breaking through it earlier this week, whilst the technical indicators are losing their upward strength, also in overbought territory, signaling at least some consolidation ahead of fresh directional strength.
Support levels: 138.00 137.65 137.10
Resistance levels: 138.85 139.20 139.60
GBP/USD Current price: 1.5350
View Live Chart for the GBP/USD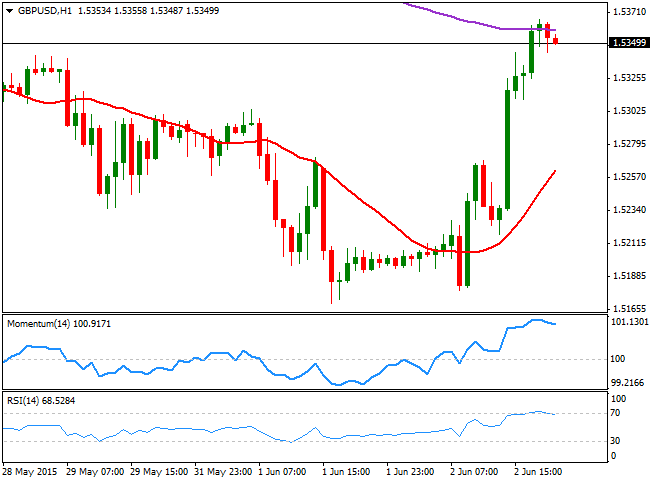
The British Pound bounced from a daily low of 1.5179, set against the American dollar during the European morning, on the back of better-than-expected UK macroeconomic data. The UK construction rebounded in May, as the UK Markit Construction PMI printed 55.9 against 55.0 expected and the previous 54.2, back in the growing path after April setback. Also, British mortgage approvals jumped by the most in more than six years in April whilst growth in lending to consumer beat expectations in the same month, up to £1.173B from previous £1.294B, revised from £1.242. The GBP/USD pair however, was unable to overcome strong selling interest around 1.5260 on a first attempt, although later EUR momentum and dollar sell-off finally gave the pair the strength to break through it. The rally extended up to 1.5366, and the 1 hour chart shows that the 20 SMA gained a strong bullish slope below the current level, although the technical indicators are signaling a downward corrective movement underway, retracing from overbought levels. In the 4 hours chart, the price is now consolidating around its 200 EMA, with the 20 SMA now flat in the 1.5260 region and the technical indicators turning lower above their mid-lines, supporting the shorter term view.
Support levels: 1.5300 1.5260 1.5225
Resistance levels: 1.5365 1.5410 1.5450
USD/JPY Current price: 124.10
View Live Chart for the USD/JPY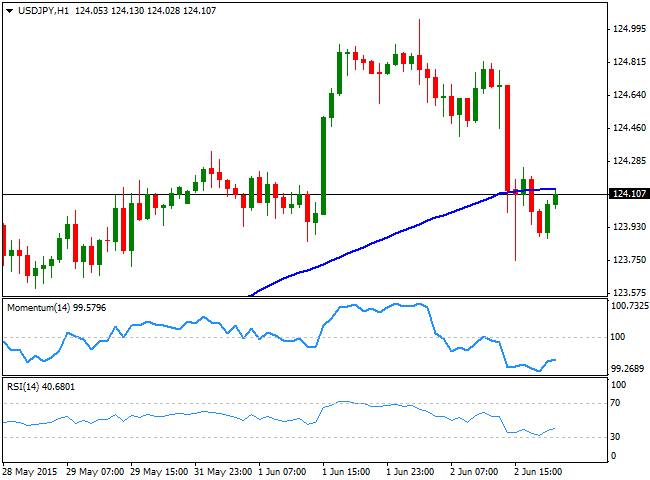
The Japanese yen posted some modest gains against its American rival, with the USD/JPY pair falling down to an intraday low of 123.74, before regaining the 124.00 level where it stays by the US close. The pair reached a fresh multi-year high of 125.04 during the previous Asian session, where broad dollar demand, coming from late Monday extended. Nevertheless and as commented on previous updates, the 125.00 level is quite a strong long term target and resistance area, and some profit taking after it got reached was already expected. Considering the downward corrective movement has held above 124.00, the long term bullish trend remains in place, albeit the short term picture points for some additional slides. In the 1 hour chart, the price is now a few pips below its 100 SMA, whilst the technical indicators have barely bounced from oversold levels, remaining deep into negative territory. In the 4 hours chart however, the technical indicators have turned flat around their mid-lines, having erased the overbought readings reached during the last few days, whilst the price consolidates in a tight 30 pips range.
Support levels: 123.75 123.40 122.90
Resistance levels: 125.10 125.50 125.90
AUD/USD Current price: 0.7777
View Live Chart for the AUD/USD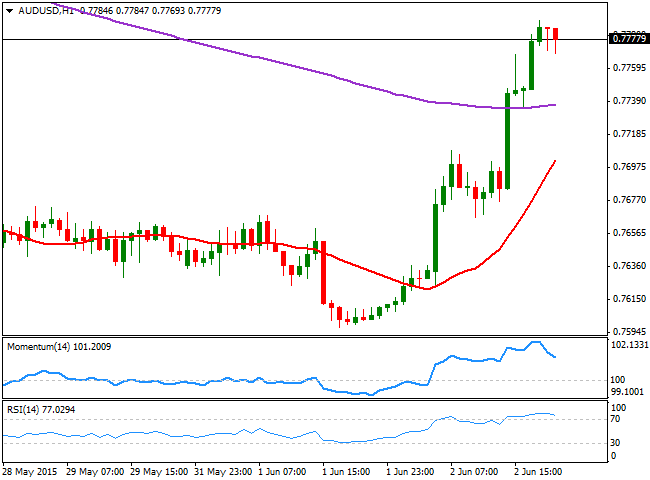
The Australian dollar surged ever since the day started, following the latest RBA economic policy decision, released at the beginning of the day. RBA Governor Glenn Stevens maintained its economic policy unchanged, albeit reaffirmed that additional policy easing cannot be ruled out, should incoming data make a case for it. The AUD/USD pair advanced up to the 0.7740 region with the news, and spent all of the European session in consolidative mode, finally approaching 0.7800 on the back of dollar's sell-off. The 1 hour chart shows that the 20 SMA advanced sharply below the current price, following price action, albeit the technical indicators are now beginning to lose upward momentum in overbought territory. In the 4 hours chart, the technical picture also suggest the rally is overextended, as indicators are also turning lower near overbought levels. Nevertheless, the upside remains favored as long as buying interest surge in the 0.7740 region, with scope to extend towards the 0.7900 on a break above the 0.7830/40 region, a strong static resistance area.
Support levels: 0.7740 0.7700 0.7655
Resistance levels: 0.7800 0.7845 0.7890
Recommended Content
Editors’ Picks
EUR/USD clings to daily gains above 1.0650

EUR/USD gained traction and turned positive on the day above 1.0650. The improvement seen in risk mood following the earlier flight to safety weighs on the US Dollar ahead of the weekend and helps the pair push higher.
GBP/USD recovers toward 1.2450 after UK Retail Sales data

GBP/USD reversed its direction and advanced to the 1.2450 area after touching a fresh multi-month low below 1.2400 in the Asian session. The positive shift seen in risk mood on easing fears over a deepening Iran-Israel conflict supports the pair.
Gold holds steady at around $2,380 following earlier spike

Gold stabilized near $2,380 after spiking above $2,400 with the immediate reaction to reports of Israel striking Iran. Meanwhile, the pullback seen in the US Treasury bond yields helps XAU/USD hold its ground.
Bitcoin Weekly Forecast: BTC post-halving rally could be partially priced in Premium

Bitcoin price shows no signs of directional bias while it holds above $60,000. The fourth BTC halving is partially priced in, according to Deutsche Bank’s research.
Week ahead – US GDP and BoJ decision on top of next week’s agenda

US GDP, core PCE and PMIs the next tests for the Dollar. Investors await BoJ for guidance about next rate hike. EU and UK PMIs, as well as Australian CPIs also on tap.