EUR/USD Current price: 1.1032
View Live Chart for the EUR/USD

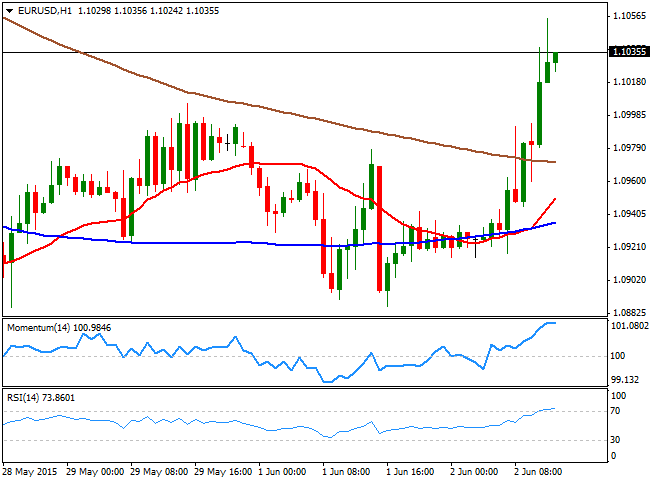
The EUR/USD break through the 1.1000 level and rallied up to a fresh high of 1.1055 on the back of market talks suggesting Greece and its creditors will reach a deal before the week is over. Tensions surrounding the troubled country arose this week, with negotiations intensifying this week. Early this Tuesday, PM Tsipras spoke on national TV, saying that the country is willing to make compromises, but also that his government is determined to maintain its anti-austerity measures, throwing the ball back to its lenders as he said he expects them to be "realistic." In the meantime, there was a meeting late Monday in Berlin of the three troika members that are said to have completed an agreement that they will present to Alexis Tsipras sometime today. Also, the common currency is finding support on improved inflation readings in the EU for May.
The EUR/USD trades in overbought levels according to intraday charts and following the latest advance, although further gains can be expected if the pair holds above the 1.1000 mark. In the 4 hours chart, the technical picture is also positive, as the price extended above a mild positive 20 SMA, whilst the technical indicators have lost their upward strength, but remain in positive territory. Renewed buying interest beyond 1.1050, should lead to an advance up to 1.1120, a strong static resistance level, furthermore on more positive news.
Support levels: 1.1000 1.0950 1.0910
Resistance levels: 1.1050 1.1085 1.1120
GBP/USD Current price: 1.5229
View Live Chart for the GBP/USD
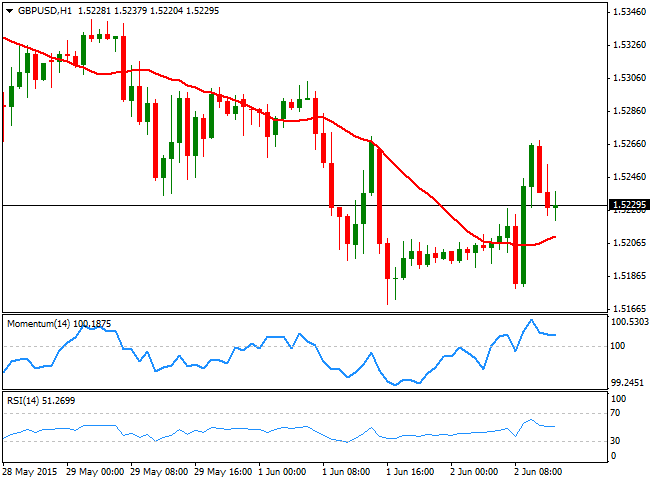
The GBP/USD pair retraces from a daily high set at 1.5268, after the release of encouraging UK data. Earlier in the day, construction PMI for May surged above expected, reaching 55.9 against 55.0 expected and 54.2 previous, whilst mortgage approvals and consumer credit also rose beyond expectations in the same month. Nevertheless, the pair was unable to advance beyond the critical resistance level, which keeps the risk towards the downside. Short term, the 1 hour chart shows that the price stands above a flat 20 SMA, whilst the technical indicators are also horizontal in neutral territory. In the 4 hours chart the price found sellers around its 20 SMA, whilst the technical indicators remain in negative territory, suggesting the pair may resume its slide, particularly on a break below the 1.5200 figure.
Support levels: 1.5170 1.5140 1.5110
Resistance levels: 1.5235 1.5260 1.5300
USD/JPY Current price: 124.63
View Live Chart for the USD/JPY
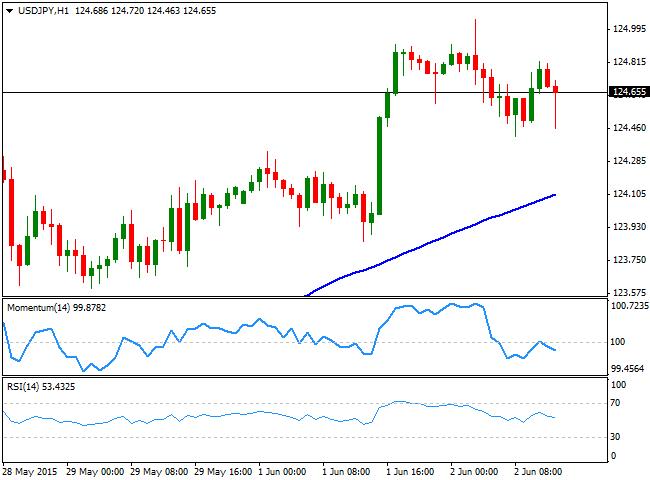
The USD/JPY pair has give up some of its latest gains, easing from its fresh multi-year high set in the Asian session at 125.04. The 1 hour chart shows that the price continues to develop well above a bullish 100 SMA around 124.10, whilst the technical indicators have turned lower, and the Momentum indicator now below its 100 level, supporting a bearish short term movement underway. In the 4 hours chart however, the price is far above its moving averages, whilst the technical indicators are turning lower near overbought levels, suggesting that the longer term bullish trend remains intact.
Support levels: 124.45 124.00 123.65
Resistance levels: 124.85 125.10 125.50
AUD/USD Current price: 0.7687
View Live Chart for the AUD/USD
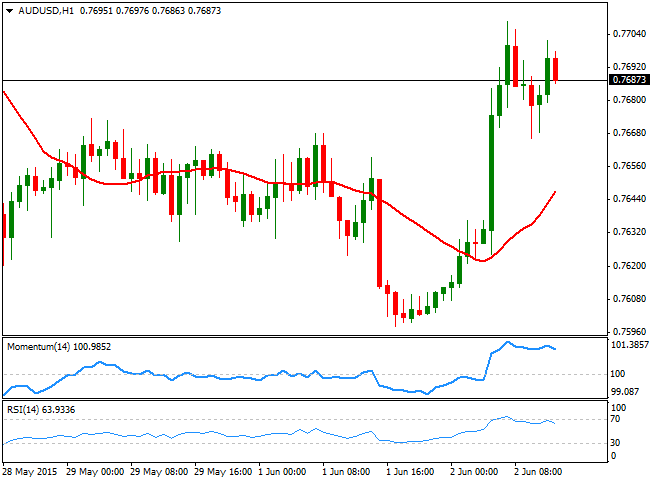
The Australian dollar got a boost from the RBA, as the Central Bank maintained its economic policy unchanged, albeit reaffirmed that additional policy easing cannot be ruled out, should incoming data make a case for it. The AUD/USD pair surged up to 0.7708 after the announcement, and trades a few pips below the 0.7700 figure, consolidating its intraday gains. Short term, the 1 hour chart shows that the price is holding above a bullish 20 SMA, currently around 0.7640, whilst the technical indicators are beginning to look exhausted in overbought territory. In the 4 hours chart, the price advanced above its 20 SMA, although the technical indicators have lost their upward strength after advancing above their mid-lines. The pair needs to extend beyond the immediate resistance, at 0.7715 to be able to extend its rally towards the 0.7800 price zone.
Support levels: 0.7670 0.7640 0.7600
Resistance levels: 0.7715 0.7750 0.7790
Recommended Content
Editors’ Picks
EUR/USD clings to daily gains above 1.0650

EUR/USD gained traction and turned positive on the day above 1.0650. The improvement seen in risk mood following the earlier flight to safety weighs on the US Dollar ahead of the weekend and helps the pair push higher.
GBP/USD recovers toward 1.2450 after UK Retail Sales data

GBP/USD reversed its direction and advanced to the 1.2450 area after touching a fresh multi-month low below 1.2400 in the Asian session. The positive shift seen in risk mood on easing fears over a deepening Iran-Israel conflict supports the pair.
Gold holds steady at around $2,380 following earlier spike

Gold stabilized near $2,380 after spiking above $2,400 with the immediate reaction to reports of Israel striking Iran. Meanwhile, the pullback seen in the US Treasury bond yields helps XAU/USD hold its ground.
Bitcoin Weekly Forecast: BTC post-halving rally could be partially priced in Premium

Bitcoin price shows no signs of directional bias while it holds above $60,000. The fourth BTC halving is partially priced in, according to Deutsche Bank’s research.
Week ahead – US GDP and BoJ decision on top of next week’s agenda

US GDP, core PCE and PMIs the next tests for the Dollar. Investors await BoJ for guidance about next rate hike. EU and UK PMIs, as well as Australian CPIs also on tap.