EUR/USD Current price: 1.1346
View Live Chart for the EUR/USD

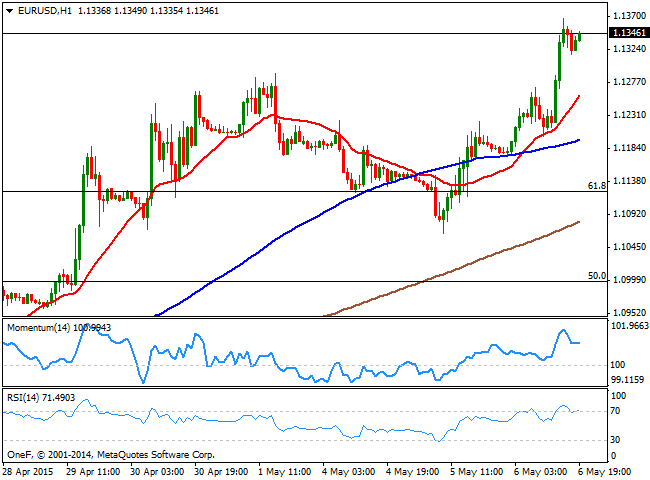
It was a combination of yet another round of weak US data and positive headlines on Greece which sent the EUR/USD pair to levels not seen since late February in the 1.1370 region. Early in the European morning, the release of the European PMIs showed that growth in the region continues, as Services and Composite figures for most of the countries and the area itself, beat expectations in April, except for German readings, slightly below expected. But it was the US ADP survey poor result which triggered a dollar sell-off, later fueled by headlines suggesting Greece and the rest of the Eurogroup could reach an agreement by Monday. The US survey on employment printed 169K against the 200K expected, anticipating another tepid Nonfarm Payroll for next Friday.
Technically, the EUR/USD pair extended sharply above the key support of 1.1120, the 61.8% retracement of the 1.1533/1.0461 slide, anticipating a full retracement towards the 1.1530 level. Short term, the 1 hour chart shows that the price has posted a limited downward correction during the American afternoon before resuming its advance, currently pressuring the daily high, whilst it stands well above its moving averages. Technical indicators in the mentioned time frame resumed their advance after correcting extreme overbought readings, all of which favors additional advances. In the 4 hours chart, the technical indicators present a strong upward momentum, whilst the price is well above its 20 SMA that slowly gains upward slope, supporting the shorter term view.
Support levels: 1.1290 1.1250 1.1210
Resistance levels: 1.1385 1.1430 1.1465
EUR/JPY Current price: 135.62
View Live Chart for the EUR/JPY
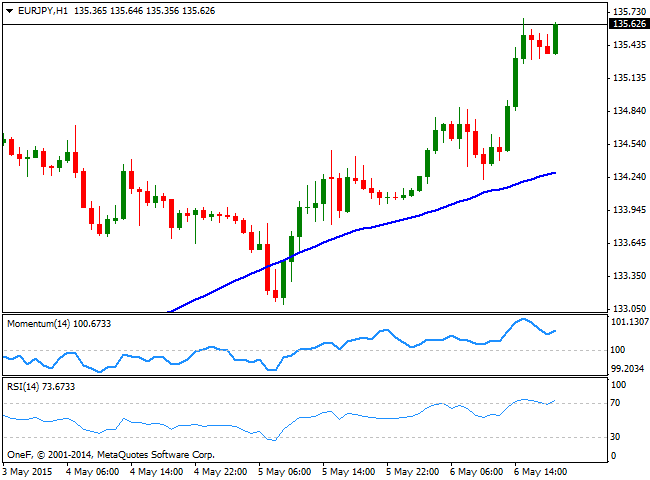
Euro self strength drove the EUR/JPY cross to a fresh 3-month high of 135.68, as the Japanese yen saw a limited advance, despite dollar tepid data and the sharp decline in Wall Street. The short term picture shows that the pair advanced above a bullish 100 SMA that provided intraday support during the past Asian session and now around 134.30, whilst the Momentum indicator stands flat above 100 and the RSI indicator heads slightly higher around 71, all of which supports the ongoing upward tone. In the 4 hours chart the technical indicators are losing their upward strength well above their mid-lines, whilst the price extended further above its moving averages in the 130.00 region, adding to the shorter term bullish case.
Support levels: 134.80 134.30 133.60
Resistance levels: 135.90 136.40 136.85
GBP/USD Current price: 1.5249
View Live Chart for the GBP/USD
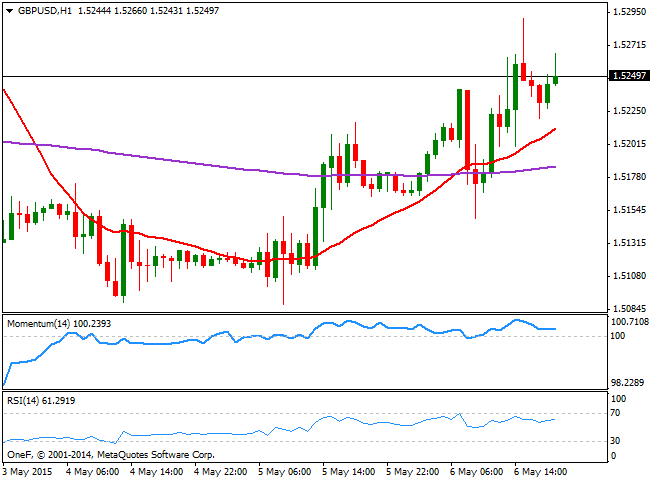
The UK services sector growth accelerated in April, reaching an 8-month high of 59.5 according to the Markit Services PMI, pushing the Pound higher against the greenback during the European session. Later on in the day, worse-than-expected US employment data pushed the GBP/USD up to 1.5290, but investors quickly profited from the rally ahead of the UK general elections this Thursday. Britain elections are in the eye on the storm as polls show the two major parties are neck-and-neck with only a couple of points of difference, which may lead to a hung Parliament. Anyway, the broad dollar weakness has pushed the pair to a fresh weekly high, and the 1 hour chart shows that a mild positive tone prevails, with the price above a bullish 20 SMA and the technical indicators aiming north in positive territory. In the 4 hours chart the price established above its 20 SMA whilst the technical indicators remain in positive territory, albeit showing no upward strength, anticipating some consolidation ahead the elections' result.
Support levels: 1.5210 1.5160 1.5120
Resistance levels: 1.5260 1.5300 1.5340
USD/JPY Current price: 119.32
View Live Chart for the USD/JPY
The USD/JPY pair fell to its lowest level of the week, reaching 119.20 before stalling. Consolidating near its lows ahead of the Asian opening, the repeated failure to advance beyond the 120.00 critical figure and the long stream of weak US macroeconomic readings continue to favor the downside in the pair. The 1 hour chart shows that the price extended below its 100 and 20 SMAs, whilst the technical indicators are losing bearish potential near oversold levels, still far from suggesting a rebound. In the 4 hours chart the overall stance is also bearish, as the Momentum indicator heads lower below 100, whilst the RSI stands around 38. Japan markets have been on a long holiday, and will resume its activity today, which means yen crosses will be exposed to high volatile moves as local investors return to their desks, although a break below the mentioned daily low, should favor a continued decline towards the 118.00 region.
Support levels: 119.45 118.90 118.50
Resistance levels: 119.80 120.10 120.45
AUD/USD Current price: 0.7965
View Live Chart for the AUD/USD
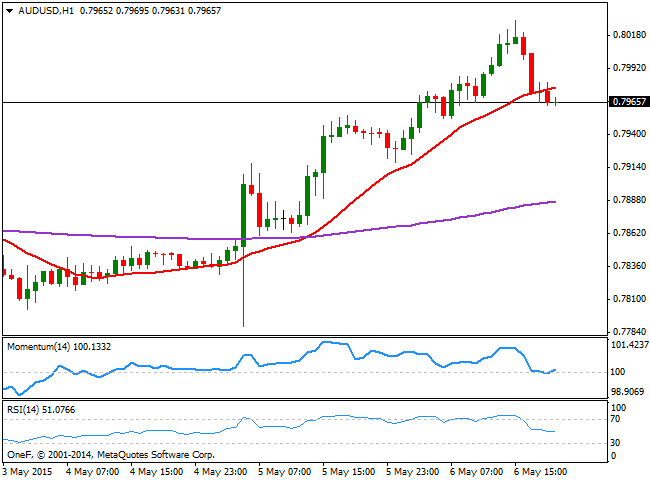
The AUD/USD pair reached a daily high of 0.8030 before shedding half of its intraday gains, with investors taking profits out of the table ahead of Australian employment figures to be released during the upcoming Asian session. Market's expectations are of an increase in the unemployment rate up to 6.2% from current 6.1%, whilst employment creation is anticipated to have been weak in April, spooking short term buyers. Technically, the 1 hour chart shows that the price is now below a bullish 20 SMA, although the technical indicators are holding above their mid-lines, and even attempting to recover, which should keep the downside limited in the short term. In the 4 hours chart the 20 SMA presents a strong upwards slope in the 0.7900 region, although the technical indicators are retracing from overbought levels, still well into positive territory. Should the data surprise to the upside, the pair will likely resume its advance pass the 0.8030 daily high and attempt a retest of the 0.8075 weekly high.
Support levels: 0.7940 0.7900 0.7860
Resistance levels: 0.7990 0.8030 0.8075
Recommended Content
Editors’ Picks
EUR/USD holds steady near 1.0650 amid risk reset

EUR/USD is holding onto its recovery mode near 1.0650 in European trading on Friday. A recovery in risk sentiment is helping the pair, as the safe-haven US Dollar pares gains. Earlier today, reports of an Israeli strike inside Iran spooked markets.
GBP/USD recovers toward 1.2450 after UK Retail Sales data

GBP/USD is rebounding toward 1.2450 in early Europe on Friday, having tested 1.2400 after the UK Retail Sales volumes stagnated again in March, The pair recovers in tandem with risk sentiment, as traders take account of the likely Israel's missile strikes on Iran.
Gold: Middle East war fears spark fresh XAU/USD rally, will it sustain?

Gold price is trading close to $2,400 early Friday, reversing from a fresh five-day high reached at $2,418 earlier in the Asian session. Despite the pullback, Gold price remains on track to book the fifth weekly gain in a row.
Bitcoin Price Outlook: All eyes on BTC as CNN calls halving the ‘World Cup for Bitcoin’

Bitcoin price remains the focus of traders and investors ahead of the halving, which is an important event expected to kick off the next bull market. Amid conflicting forecasts from analysts, an international media site has lauded the halving and what it means for the industry.
Geopolitics once again take centre stage, as UK Retail Sales wither

Nearly a week to the day when Iran sent drones and missiles into Israel, Israel has retaliated and sent a missile into Iran. The initial reports caused a large uptick in the oil price.