EUR/USD Current price: 1.1195
View Live Chart for the EUR/USD
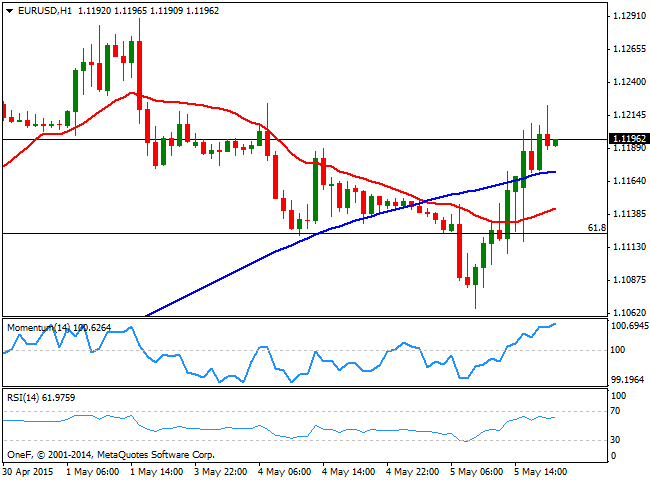
The American dollar started the day with a strong footing, driving the EUR/USD pair to a fresh 4-day low of 1.1056 during the European morning. But as the US extended its steady stream of poor macroeconomic data, the greenback changed course, closing the day with losses against all of its major rivals. In Europe, the release of the EU Commission forecast gave the euro an initial boost, as both GDP and inflation figures were revised higher for this 2015. At the same time, concerns over Greece arose, but EUR buyers ignored the negative headlines, and focused on US data. The American trade balance deficit grew to 51.37B in March, over 10B larger than market expectations, whilst the Markit services PMI for April resulted at 57.4, slightly below expectations and previous reading of 57.8. Economic optimism in the US also dropped, down to 49.7 in May.
The EUR/USD pair rose as high as 1.1225 before settling around the 1.1200 level by US close, recovering its bullish tone. Short term, the 1 hour chart shows that the price regained ground above a bullish 100 SMA, whilst the technical indicators maintain their upward slopes in positive territory. In the 4 hours chart the latest candle opened above a flat 20 SMA, whilst the Momentum indicator heads higher below the 100 level and the RSI indicator consolidates around 59, all of which anticipates additional advances, should the price extend above the mentioned daily high.
Support levels: 1.1160 1.1120 1.1095
Resistance levels: 1.1225 1.1260 1.1300
EUR/JPY Current price: 134.29
View Live Chart for the EUR/JPY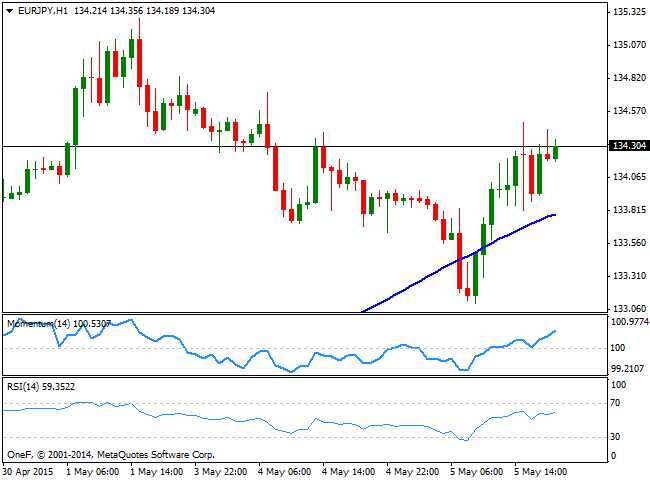
The recovery in the common currency dragged the EUR/JPY cross back higher, after it fell down to an intraday low of 133.10 earlier in the day. The yen has been generally weaker across the board until the release of the US data, adding to the bullish case in the EUR/JPY. Technically the 1 hour chart shows that the price fell briefly below its 100 SMA that anyway maintains a strong bullish slope, currently in the 133.80 region, whilst the technical indicators maintain a positive tone well above their mid-lines. In the 4 hours chart the Momentum indicator stands directionless right below 100 whilst the RSI loses upward strength around 61, supporting additional advances particularly on an extension beyond the immediate resistance at 134.70.
Support levels: 133.55 133.00 132.60
Resistance levels: 134.10 134.70 135.20
GBP/USD Current price: 1.5180
View Live Chart for the GBP/USD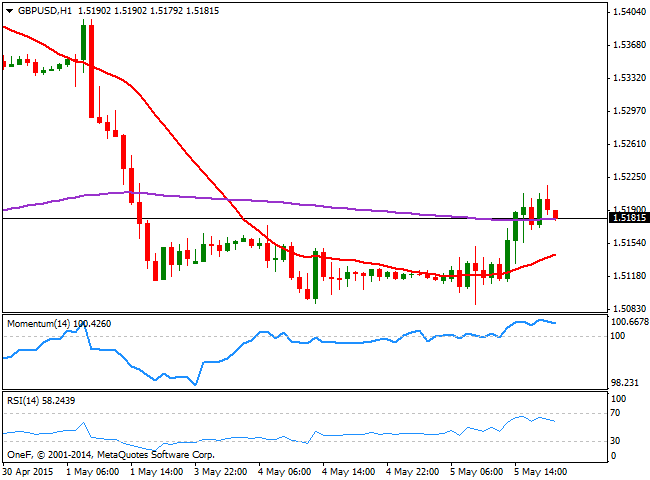
The British Pound woke up from its lethargy following the release of disappointing US data, surging to a daily high of 1.5217 before retracing some. There were no fundamental releases in the UK, and all attention continues to be centered in the upcoming elections. According to the latest opinion polls, the Conservatives are two points ahead the Labour party, although the two bigger parties are still almost even, and investors continue to fear a resulting hung Parliament. Technically, the pair is losing its upward potential according to the 1 hour chart, as the technical indicators are turning lower, but still above their mid-lines, whilst the 20 SMA heads higher, offering dynamic support around 1.5120. In the 4 hours chart, the price is retracing from a bearish 20 SMA, as the pair posted a short lived spike above it, but failed to sustain its gains, whilst the Momentum indicator heads higher and is about to cross the 100 level to the upside, and the RSI indicator turned lower around 46. The upside will likely remain limited as the election date looms, with risk of a decline down to 1.5040 should the pair resume its slide.
Support levels: 1.5130 1.5085 1.5040
Resistance levels: 1.5215 1.5250 1.5295
USD/JPY Current price: 119.85
View Live Chart for the USD/JPY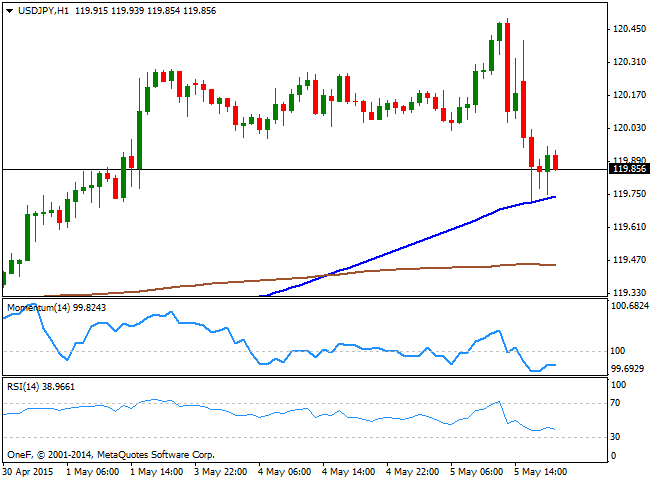
The USD/JPY pair surged to a 3-week high of 120.49 before poor US data sent the greenback lower against its Asian rival. The pair has been steadily pushing through the 120.00 critical figure for over a month, but seems unable to sustain gains above it. Disappointing US data sent the pair down to 119.71, with the pair consolidating slightly above it after breaking lower. The 1 hour chart shows that the 100 SMA presents a bullish slope and offers intraday support around 119.70, whilst the technical indicators present a limited bearish tone below their mid-lines. In the 4 hours chart the technical indicators present a strong bearish momentum after crossing below their mid-lines, supporting additional declines ahead, particularly if the mentioned support gives up. The key support however, comes at 119.30, with a break below it probably fueling the decline towards sub 119.00 levels.
Support levels: 119.70 119.30 118.80
Resistance levels: 120.10 120.45 120.85
AUD/USD Current price: 0.7943
View Live Chart for the AUD/USD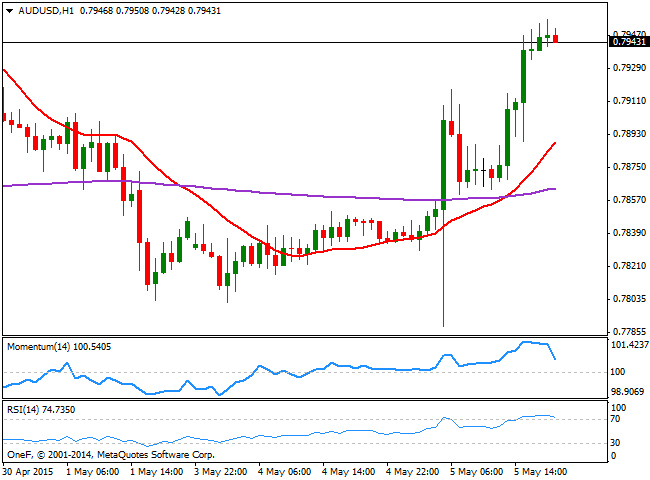
It was a wild roller-coaster for Aussie ever since the RBA announce a rate cut during the past Asian session. The Reserve Bank of Australia lowered its benchmark rate by 25bp to 2.0%, and the AUD/USD pair fell down to 0.7788 right after the announcement, only to bounce up above the 0.7900 region in a matter of minutes. The surge in the price came as investors were surprised by a less dovish than expected speech from Governor Stevens, and the inflation outlook, as the RBA said its consistent with its target over the forthcoming years. The pair fell down to 0.7860 during the European session, but surged to fresh highs around 0.7950 on the back of dollar sell-off. Technically the 1 hour chart shows that, despite the price consolidates near the high, the Momentum indicator diverges lower, whilst the RSI stands steady around 77 and the 20 SMA heads higher around 0.7890, all of which should keep the downside limited. In the 4 hours chart however, the overall stance is bullish, as the price advanced sharply above its 20 SMA, whilst the technical indicators head north well above their mid-lines.
Support levels: 0.7860 0.7800 0.7770
Resistance levels: 0.7900 0.7940 0.7980
Recommended Content
Editors’ Picks
EUR/USD holds above 1.0650 after US data

EUR/USD retreats from session highs but manages to hold above 1.0650 in the early American session. Upbeat macroeconomic data releases from the US helps the US Dollar find a foothold and limits the pair's upside.
GBP/USD retreats toward 1.2450 on modest USD rebound

GBP/USD edges lower in the second half of the day and trades at around 1.2450. Better-than-expected Jobless Claims and Philadelphia Fed Manufacturing Index data from the US provides a support to the USD and forces the pair to stay on the back foot.
Gold clings to strong daily gains above $2,380

Gold trades in positive territory above $2,380 on Thursday. Although the benchmark 10-year US Treasury bond yield holds steady following upbeat US data, XAU/USD continues to stretch higher on growing fears over a deepening conflict in the Middle East.
Ripple faces significant correction as former SEC litigator says lawsuit could make it to Supreme Court

Ripple (XRP) price hovers below the key $0.50 level on Thursday after failing at another attempt to break and close above the resistance for the fourth day in a row.
Have we seen the extent of the Fed rate repricing?

Markets have been mostly consolidating recent moves into Thursday. We’ve seen some profit taking on Dollar longs and renewed demand for US equities into the dip. Whether or not this holds up is a completely different story.