EUR/USD Current price: 1.1194
View Live Chart for the EUR/USD

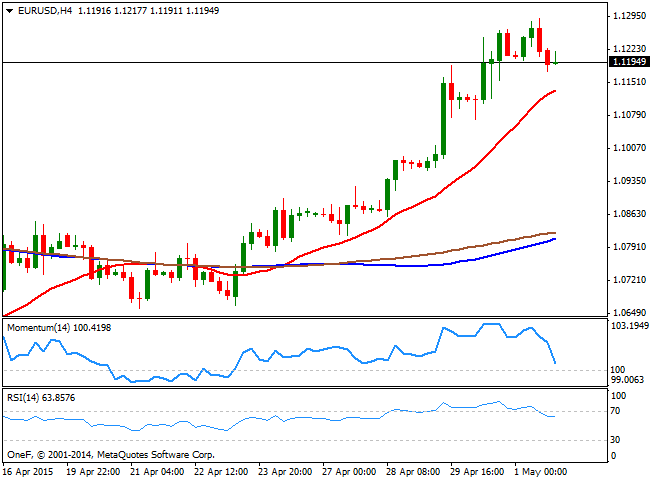
The EUR/USD extended its weekly advance up to 1.1289 last Friday, before turning south and close the day in the red around the 1.1200 figure. The American dollar found buying interest in the first day of the new month, mostly coming from local traders, as most European markets were close on holidays. The greenback's rally come even despite US data missed expectations, although the EUR/USD pair has staged its highest close in eight weeks. The upcoming week will be fulfilled with macroeconomic readings, starting on Monday with European PMI's, which had been steadily signaling a recovery in the EU. But no doubts the main event of the week will be US Nonfarm Payroll figures on Friday, with the US employment figures probably being a make it or break it for the ongoing dollar's bearish trend.
Technically, the pair has closed the week above the 1.1120, the 61.8% retracement of the 1.1533/1.0461 decline, which should maintain the risk towards the upside. In the short term the 4 hours chart shows that the 20 SMA maintains a strong upward slope around 1.1130, whilst the Momentum indicator turned sharply lower from overbought territory and is about to close the 100 level towards the downside. The RSI indicator however, has managed to correct overbought readings and now hovers around the 63 level, limiting chances of a stronger decline.
Support levels: 1.1160 1.1120 1.1085
Resistance levels: 1.1245 1.1290 1.1330
EUR/JPY Current price: 134.58
View Live Chart for the EUR/JPY
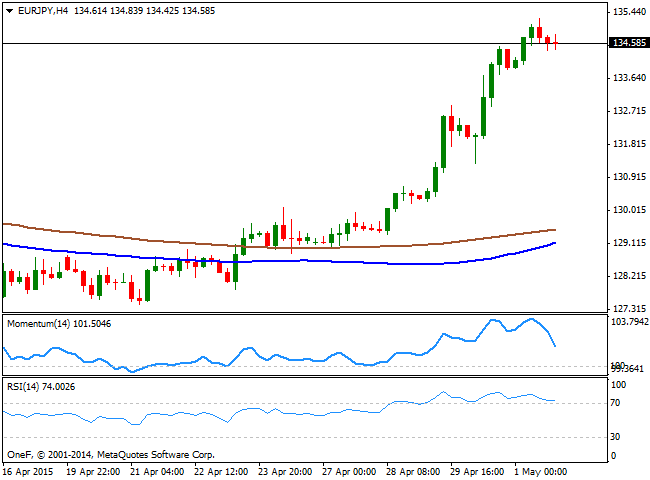
The Japanese yen has weakened further by the end of last week, despite the Bank of Japan has kept its economic policy unchanged. The strong recovery in stocks has weighted, however, in the Asian currency. Japan will be closed on holidays in this last first of the week, something that should keep volumes limited in the Asian session. As for the EUR/JPY, the cross has reached a fresh 3-month high of 135.27 on Friday, but retraced to close the day around the 134.50 region. The technical picture favors some additional bearish corrections, as in the 4 hour chart, the Momentum indicator heads sharply lower from overbought levels whist the RSI also corrects south, albeit remains in extreme levels, around 74. The level to watch to the downside is 133.90, as a break below it should trigger some short term stops and fuel the decline. An advance beyond the mentioned high on the other hand, exposes the pair to an advance beyond the 136.00 level should the EUR regain its charm.
Support levels: 134.40 133.90 133.30
Resistance levels: 135.30 135.70 136.20
GBP/USD Current price: 1.5138
View Live Chart for the GBP/USD
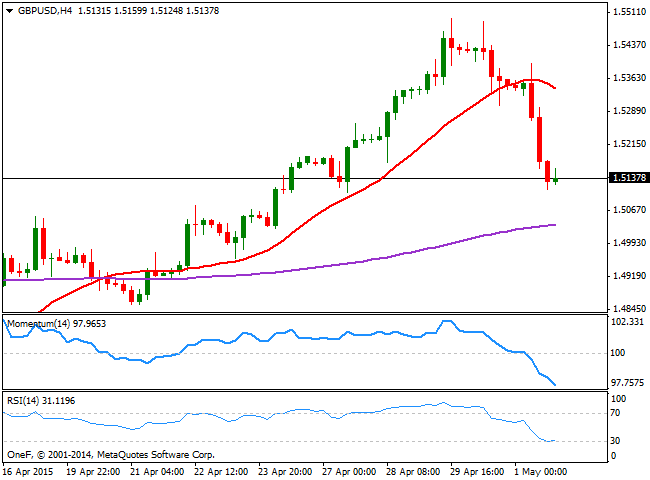
The British Pound nose-dived on Friday, as investors rushed to profit from recent rally in the UK currency ahead of elections. The GBP/USD pair lost 2 full cents on Friday, retracing even further from the weekly high set at 1.5497 last Wednesday. Local data disappointed, fueling the slide, as the Markit Manufacturing PMI for April printed 51.9 against the previous 54.4, whilst Mortgage approvals decreased beyond expectations. London will have a bank holiday this Monday, which means there will be no fundamental releases in the UK, and the attention will continue to gather in the results of the upcoming elections and the possibility of a hung Parliament. Technically, the 4 hours chart shows that the 20 SMA turned lower above the current price as the price extended below it, whist the Momentum indicator maintains its bearish slope well below its 100 level, and the RSI indicator heads lower around 31, all of which keeps the risk towards the downside, particularly if the 1.5210 resistance level contains intraday rallies.
Support levels: 1.5110 1.5070 1.5035
Resistance levels: 1.5170 1.5210 1.5260
USD/JPY Current price: 120.21
View Live Chart for the USD/JPY
The USD/JPY pair surged above the 120.00 figure on Friday, backed by falling treasuries and rising stocks. The tepid US data was unable to affect the pair that closed the day a few pips below its high established at 120.28. Technically, the bullish tone prevails as the pair has finally advanced above its 100 SMA after struggling below it for most of the last week. In the 4 hours chart the Momentum indicator heads sharply higher, despite being in extreme overbought levels, whilst the RSI is losing its upward potential around 67, limiting the possibility of another leg higher. In the same chart, the price stands well above its moving averages, albeit the 100 SMA stands below the 200 SMA, and both maintain a mild bearish slope, indicating that the downside is still favored in the longer term.
Support levels: 120.00 119.65 119.30
Resistance levels: 120.45 120.85 122.10
AUD/USD Current price: 0.7845
View Live Chart for the AUD/USD
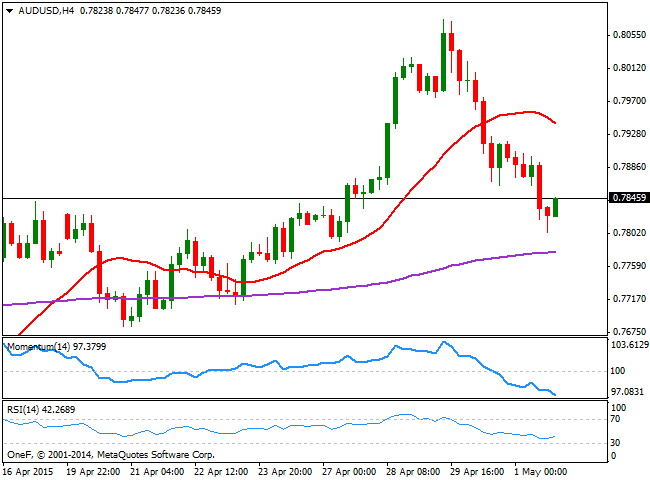
The Australian dollar fell against the greenback down to 0.7802, before finally finding some short term buying interest. The Aussie will have to face two major local events this week, the RBA economic policy meeting early Tuesday, and the monthly employment report on Thursday. As for the first, Governor Glenn Stevens is expected to down-talk the local currency as usual, and there is a limited risk of a surprise rate cut from the current 2.25% benchmark. As for employment data the unemployment rate is expected to rise to 6.2% whilst the economy is expected to add just 4K new jobs compared to previous 37.7K, all of which should weigh on the local currency. Technically, the 4 hours chart shows that technical readings are biased strongly lower, with the 20 SMA turning south in the 0.7940 region and the Momentum indicator heading lower well below 100, anticipating additional declines particularly on a break below the 0.7800 figure. The 0.7940 has been quite a strong static resistance level, so it will take an advance beyond it to call for an upward continuation, back towards the recent highs in the 0.8100 region.
Support levels: 0.7800 0.7770 70.7730
Resistance levels: 0.7860 0.7900 0.7940
Recommended Content
Editors’ Picks
EUR/USD fluctuates near 1.0700 after US data

EUR/USD stays in a consolidation phase at around 1.0700 in the American session on Wednesday. The data from the US showed a strong increase in Durable Goods Orders, supporting the USD and making it difficult for the pair to gain traction.
USD/JPY refreshes 34-year high, attacks 155.00 as intervention risks loom

USD/JPY is renewing a multi-decade high, closing in on 155.00. Traders turn cautious on heightened risks of Japan's FX intervention. Broad US Dollar rebound aids the upside in the major. US Durable Goods data are next on tap.
Gold stays in consolidation above $2,300

Gold finds it difficult to stage a rebound midweek following Monday's sharp decline but manages to hold above $2,300. The benchmark 10-year US Treasury bond yield stays in the green above 4.6% after US data, not allowing the pair to turn north.
Worldcoin looks set for comeback despite Nvidia’s 22% crash Premium

Worldcoin price is in a better position than last week's and shows signs of a potential comeback. This development occurs amid the sharp decline in the valuation of the popular GPU manufacturer Nvidia.
Three fundamentals for the week: US GDP, BoJ and the Fed's favorite inflation gauge stand out Premium

While it is hard to predict when geopolitical news erupts, the level of tension is lower – allowing for key data to have its say. This week's US figures are set to shape the Federal Reserve's decision next week – and the Bank of Japan may struggle to halt the Yen's deterioration.