EUR/USD Current price: 1.1007
View Live Chart for the EUR/USD

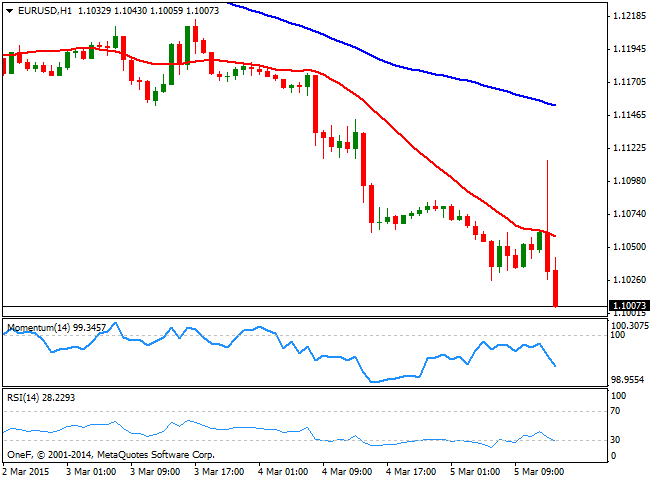
The EUR/USD pair raised following Draghi's initial speech, as the ECB president announced the Central Bank will begin purchasing bonds as soon as next Monday, albeit the pair quickly retraced towards fresh 11 year lows a few pips above 1.1000. Despite the economic outlook has been reviewed to the upside, and the ECB president gave a positive review on how the economy is doing this year, selling interest around 1.1100 was way too much for the mild hawkish review. Technically, the 1 hour chart shows that the price holds below a bearish 20 SMA, whilst the indicators gain strong bearish momentum below their mid-lines, supporting the ongoing slide. In the 4 hours chart the technical indicators also present a strong bearish tone, with the RSI heading lower despite being in extreme overbought readings, pointing for a break down to 1.0960 should the 1.1000 level gives up.
Support levels: 1.1000 1.0960 1.0920
Resistance levels: 1.1050 1.1100 1.1145
GBP/USD Current price: 1.5236
View Live Chart for the GBP/USD
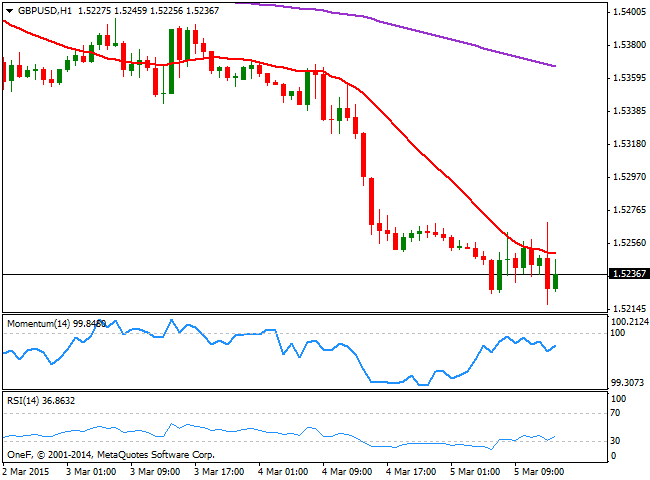
The GBP/USD pair fell as low as 1.5217 following a limited upward spike to 1.5269, consolidating around pre news levels. The pair is being weighed by dollar demand, and the 1 hour chart presents a mild bearish tone, as the price develops below its 20 SMA and the technical indicators remain below their mid-lines, albeit with tepid bullish slopes. In the 4 hours chart the technical indicators are biased strongly south well into negative territory, anticipating some further declines particularly if 1.5210 the immediate support, gives up.
Support levels: 1.5210 1.5180 1.5135
Resistance levels: 1.5250 1.590 1.5330
USD/JPY Current price: 120.04
View Live Chart for the USD/JPY
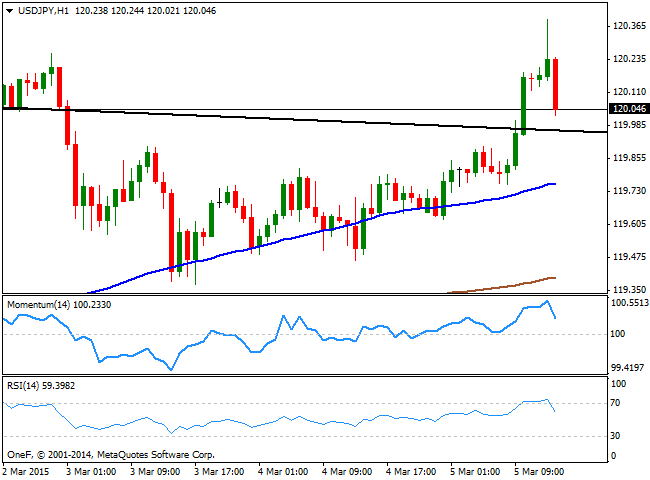
The USD/JPY pair reached a daily high of 120.39 before the news, reversing its intraday gains and now pressuring the 120.00 figure. The 1 hour chart shows that indicators turned lower from overbought levels, but that the price remains well above its 100 and 200 SMAs. The price also stands above a daily descendant trend line coming from the multi-year high reached last year at 121.84, now offering support around 119.90. In the 4 hours chart, the technical indicators lost upward potential above their mid-lines, not giving too much clues on what's next on the pair. The most likely scenario is some consolidation around the current levels, ahead of Friday's US employment figures.
Support levels: 119.90 119.40 119.10
Resistance levels: 120.45 120.90 121.35
AUD/USD Current price: 0.7790
View Live Chart for the AUD/USD
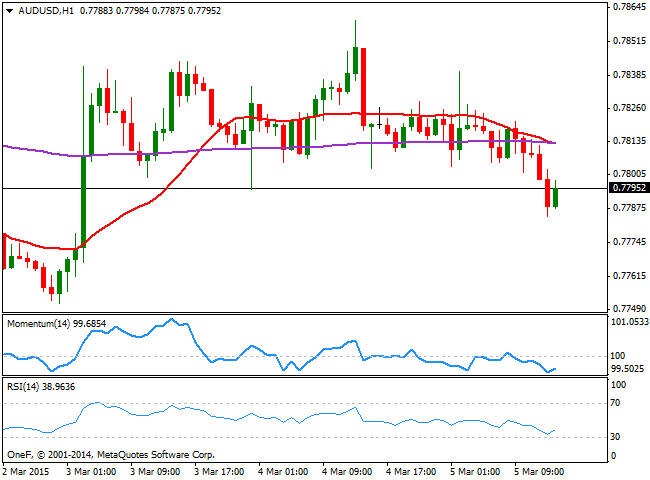
The Australian dollar has shown a limited reaction to ECB announcement, as the AUD/USD pair turned south before the news, reaching 0.7784 before bouncing some. Trading below the 0.7800 level, the 1 hour chart presents a limited bearish tone, as the price develops below its moving averages and indicators hover below their midlines, albeit lacking bearish strength. In the 4 hours chart however the bearish tone is firmer, as the price extends below its 20 SMA and the technical indicators are crossing their mid-lines, extending into negative territory.
Support levels: 0.7755 0.7720 0.7690
Resistance levels: 0 .7800 0.7840 0.7890
Recommended Content
Editors’ Picks
EUR/USD regains traction, recovers above 1.0700

EUR/USD regained its traction and turned positive on the day above 1.0700 in the American session. The US Dollar struggles to preserve its strength after the data from the US showed that the economy grew at a softer pace than expected in Q1.
GBP/USD returns to 1.2500 area in volatile session

GBP/USD reversed its direction and recovered to 1.2500 after falling to the 1.2450 area earlier in the day. Although markets remain risk-averse, the US Dollar struggles to find demand following the disappointing GDP data.
Gold climbs above $2,340 following earlier drop

Gold fell below $2,320 in the early American session as US yields shot higher after the data showed a significant increase in the US GDP price deflator in Q1. With safe-haven flows dominating the markets, however, XAU/USD reversed its direction and rose above $2,340.
XRP extends its decline, crypto experts comment on Ripple stablecoin and benefits for XRP Ledger

Ripple extends decline to $0.52 on Thursday, wipes out weekly gains. Crypto expert asks Ripple CTO how the stablecoin will benefit the XRP Ledger and native token XRP.
After the US close, it’s the Tokyo CPI

After the US close, it’s the Tokyo CPI, a reliable indicator of the national number and then the BoJ policy announcement. Tokyo CPI ex food and energy in Japan was a rise to 2.90% in March from 2.50%.