EUR/USD Current price: 1.1196
View Live Chart for the EUR/USD
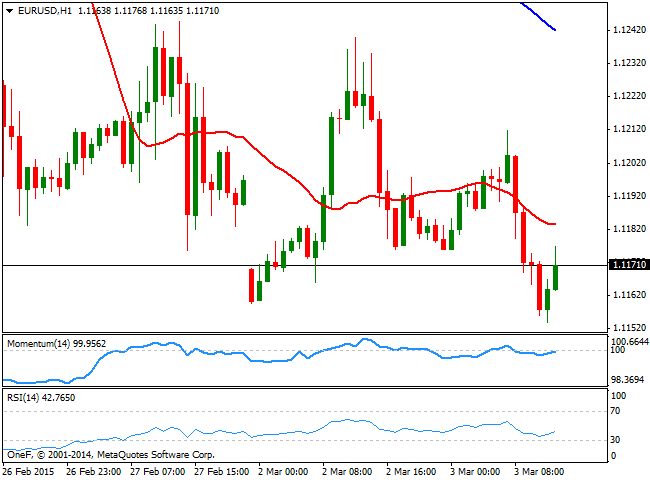
Support levels: 1.1140 1.1095 1.1050
Resistance levels: 1.1210 1.1250 1.1285
GBP/USD Current price: 1.5357
View Live Chart for the GBP/USD
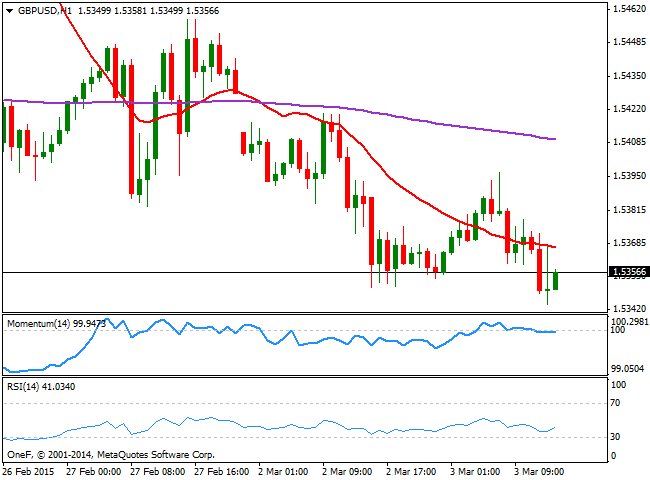
The GBP/USD trades near a daily low set at 1.5343 so far today, presenting a limited bearish tone in the short term, as the 1 hour chart shows that the price holds below a bearish 20 SMA, whilst the technical indicators remain directionless in negative territory. In the 4 hours chart the technical picture favors the downside, as the 20 SMA gained bearish slope, now coping the upside around 1.5400, while the technical indicators head lower below their mid-lines. Nevertheless, the 200 EMA offers a strong dynamic resistance around 1.5335, and it will take a clear break below it to confirm additional declines towards the 1.5290 price zone.
Support levels: 1.5335 1.5290 1.5250
Resistance levels: 1.5400 1.5450 1.5490
USD/JPY Current price: 119.68
View Live Chart for the USD/JPY
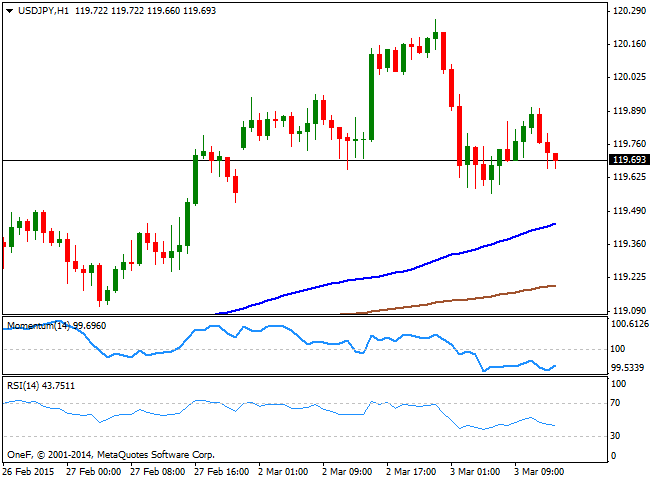
The USD/JPY pair eased back below the 120.00 level during Asian trading hours, back towards its weekly opening levels. Having failed once again to sustain gains beyond the critical figure, and having posted a lower high weekly basis, the risk of a new leg south has increased substantially. From a technical point of view and in the short term, the 1 hour chart shows that the price continues to develop above its 100 and 200 SMAs, but the technical indicators are now below their mid-lines, with the RSI heading south around 44, anticipating some further decline. In the 4 hours chart the indicators are heading lower and approaching their midlines, which means a break below 119.40 support is required to confirm the bearish extension, eyeing then the 118.80 price zone.
Support levels: 119.40 118.80 118.50
Resistance levels: 119.95 120.45 120.90
AUD/USD Current price: 0.7820
View Live Chart for the AUD/USD
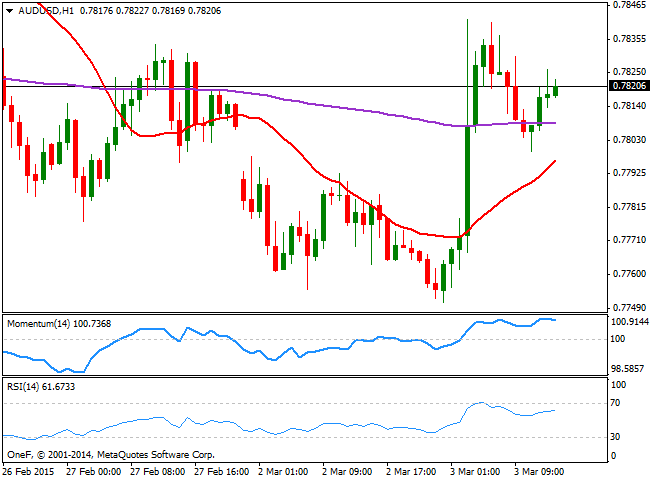
The Aussie surged on relief, after the RBA decided to keep rates on hold this month, with the AUD/USD surging to a fresh weekly high of 0.7831, and finding short term buying interest around the 0.7800 figure, now the immediate support. The 1 hour chart shows that the price stands well above a bullish 20 SMA, although the technical indicators lack upward strength but stand in positive territory. In the 4 hours chart, the pair presents a neutral technical stance, with the price above a bearish 20 SMA and indicators flat around their midlines, suggesting the upward strength may be over, but not yet confirming an upcoming leg lower.
Support levels: 0.7800 0.7755 0.7720
Resistance levels: 0.7840 0.7890 0.7925
Recommended Content
Editors’ Picks
EUR/USD clings to daily gains above 1.0650

EUR/USD gained traction and turned positive on the day above 1.0650. The improvement seen in risk mood following the earlier flight to safety weighs on the US Dollar ahead of the weekend and helps the pair push higher.
GBP/USD recovers toward 1.2450 after UK Retail Sales data

GBP/USD reversed its direction and advanced to the 1.2450 area after touching a fresh multi-month low below 1.2400 in the Asian session. The positive shift seen in risk mood on easing fears over a deepening Iran-Israel conflict supports the pair.
Gold holds steady at around $2,380 following earlier spike

Gold stabilized near $2,380 after spiking above $2,400 with the immediate reaction to reports of Israel striking Iran. Meanwhile, the pullback seen in the US Treasury bond yields helps XAU/USD hold its ground.
Bitcoin Weekly Forecast: BTC post-halving rally could be partially priced in Premium

Bitcoin price shows no signs of directional bias while it holds above $60,000. The fourth BTC halving is partially priced in, according to Deutsche Bank’s research.
Week ahead – US GDP and BoJ decision on top of next week’s agenda

US GDP, core PCE and PMIs the next tests for the Dollar. Investors await BoJ for guidance about next rate hike. EU and UK PMIs, as well as Australian CPIs also on tap.
