EUR/USD Current price: 1.1307
View Live Chart for the EUR/USD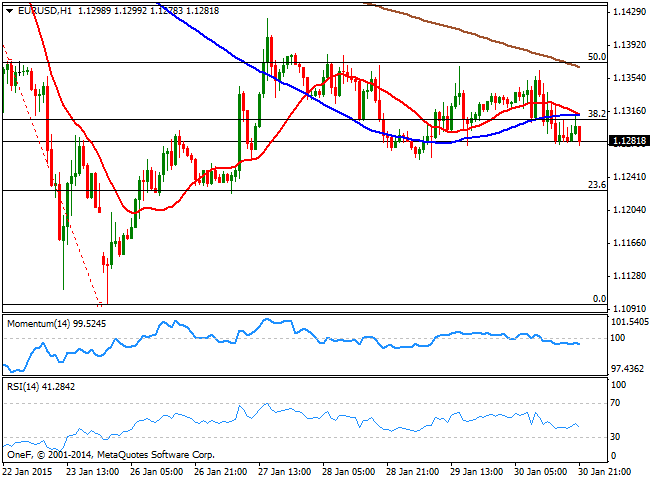
The last week of January ended up with the dollar quite mixed against its rivals, higher against commodity currencies but down against most of its major rivals. The dollar however edged higher on Friday, despite the advanced reading of Q4 GDP data, expected to come in at 3.3%, resulted at 2.6% almost half the third quarter final reading of 5%. Monday will bring PMI readings from Europe, generally expected to have ticked higher which can give the common currency some support. During the weekend, Greek PM Tsipras say announced some upcoming measures which include repaying its debt to the ECB and the IMF, but negotiate with the EZ countries the rest of the debt. It´s coalition partner, Kammenos, plans to propose a tax amnesty on undeclared incomes. The news may bring some relief to the common currency, and favor a gap to the upside with the weekly opening, dragging therefore high yielders higher.
In the meantime, the EUR/USD trades below the 1.1300 level, maintaining the negative tone. Short term, the 1 hour chart shows that the price stands below both, 20 and 100 SMAs that converge at 1.1310 offering immediate short term resistance, whilst indicators grind lower in negative territory, pointing for a continued slide. In the 4 hours chart, price has been hovering around a directionless 20 SMA for most of the last few days, now a few pips below it, whilst indicators aim lower below their midlines, but lack momentum ahead of the opening. Some intraday lows in the 1.1250 price zone offer immediate support, whilst sellers have been surging around 1.1365, 50% retracement of the latest bearish run. A break of either extreme is required to take the pair out of its range and set a clearer directional trend.
Support levels: 1.1250 1.1210 1.1160
Resistance levels: 1.1320 1.1365 1.1400
EUR/JPY Current price: 132.50
View Live Chart for the EUR/JPY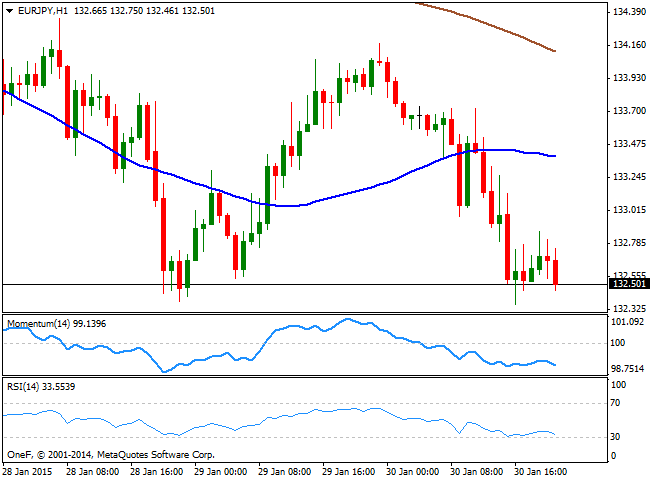
The EUR/JPY closed down at 132.50 last week, maintaining an overall negative tone in the short term. The 1 hour chart shows that price develops below 100 and 200 SMAs ahead of the opening, whilst indicators aim slightly lower below their midlines. in the 4 hours chart the technical picture is also bearish with some strong selling interest aligned now in the 134.10 price zone. Further declines below the 132.30 level should see the pair approaching 131.70, whilst a break below this last should see bulls capitulating and the bearish trend gain momentum.
Support levels: 132.30 131.70 131.20
Resistance levels: 132.80 133.50 134.10
GBP/USD Current price: 1.5053
View Live Chart for the GBP/USD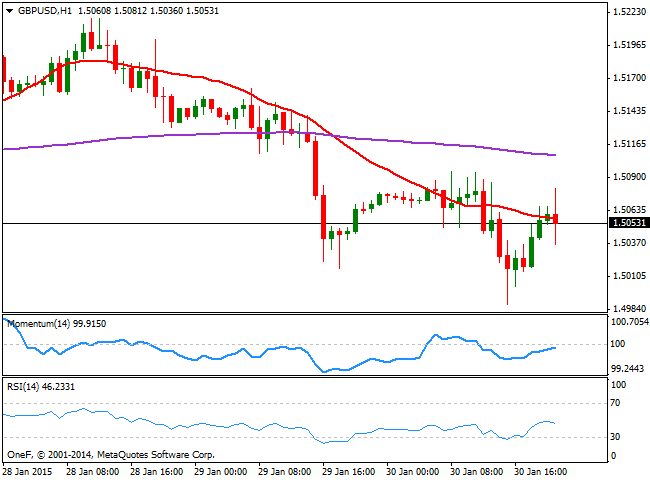
The Cable closed last week with some limited gains a few pips above the 1.5000 level, having resumed the downside after a couple of failed attempts to recover the 1.5200 mark. Nevertheless, the critical 1.5000 figure has held the downside, last week which limits for now the risk of a stronger decline. On Monday, the UK will release its PMI figures, expected to show some signs of improvement which should result in a stronger Pound. Short term, the 1 hour chart shows that the price is hovering around a mild bearish 20 SMA, whilst indicators stand flat below their midlines. In the 4 hours chart the price develops below its 20 SMA that gains some bearish slope in the 1.5110 price zone, while indicators head slightly lower below their midlines, favoring the downside particularly on a break below the 1.5000 figure.
Support levels: 1.5010 1.4970 1.4925
Resistance levels: 1.5060 1.5100 1.5150
USD/JPY Current price: 117.47
View Live Chart for the USD/JPY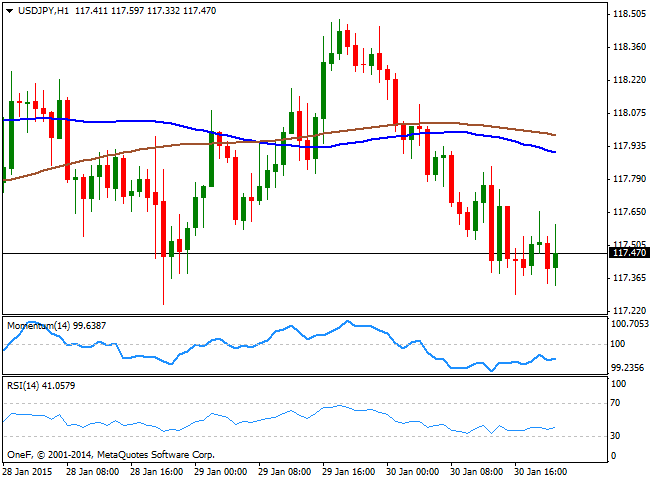
The USD/JPY pair has traded flat for most of last week, well limited in range, although for the most heavy, as the yen found favor in falling stocks. Having found buyers in the 117.00/30 region, the pair closed Friday near its lows, leaving the intraday charts with a mild bearish tone. In the 1 hour chart, the price stands well below its moving averages, with both, 100 and 200 SMAs acting as dynamic resistances in the 117.90 region, while indicators stand flat in neutral territory, showing no directional strength. In the 4 hours chart 100 SMA broke below 200 SMA earlier last week, with the distance in between both widening, which reflects an increasing bearish potential, while indicators are also flat below their midlines. At this point, stops should be large below 117.00 so if triggered, the pair can made a quick run towards its next support, at 116.60. The top of the range stands at 118.80, and a clear break above it is required to see a shift towards the upside, quite unlikely at this point.
Support levels: 117.00 116.60 116.20
Resistance levels: 117.60 118.10 118.50
AUD/USD Current price: 0.7753
View Live Chart of the AUD/USD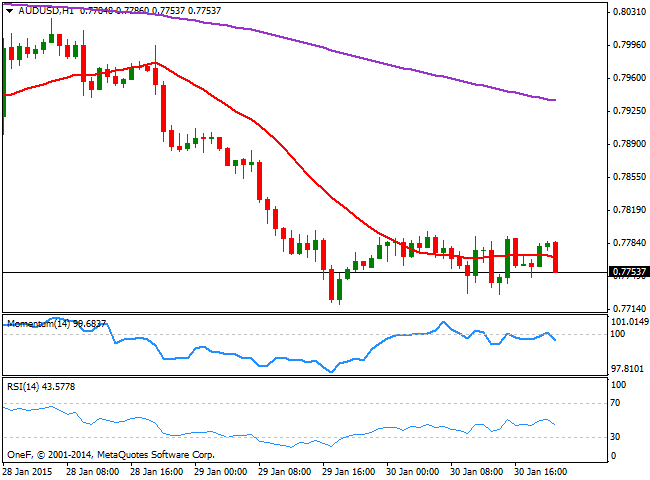
The AUD/USD trades near a 5 and a half year low set last week at 0.7719, and is poised to extend its decline, as over the weekend, Chinese Manufacturing PMI fell to contraction levels in January, for the first time in more than two tears. Therefore, commodity related currencies such as the AUD are likely to start the week gapping lower and accelerate their slides. Last week, an ultra dovish RBNZ sent NZD also to fresh multi-years lows, also weighting in the Aussie. Short term, the 1 hour chart shows that the pair has been consolidating below the 0.7800 mark, for the most flat during the last 24 hours, although indicators maintain a bearish tone heading south into negative territory. In the 4 hours chart the technical picture is clearly bearish, with the price developing well below its 20 SMA whilst indicators aim lower near oversold territory. The immediate support stands at 0.7701, September 2009 monthly low. On the other hand, an advance above 0.7810 should favor some further recoveries, that can extend up to 0.7900 during this Monday.
Support levels: 0.7700 0.7665 0.7630
Resistance levels: 0.7810 0.7860 0.7900
Recommended Content
Editors’ Picks
EUR/USD extends gains above 1.0700, focus on key US data

EUR/USD meets fresh demand and rises toward 1.0750 in the European session on Thursday. Renewed US Dollar weakness offsets the risk-off market environment, supporting the pair ahead of the key US GDP and PCE inflation data.
GBP/USD extends recovery above 1.2500, awaits US GDP data

GBP/USD is catching a fresh bid wave, rising above 1.2500 in European trading on Thursday. The US Dollar resumes its corrective downside, as traders resort to repositioning ahead of the high-impact US advance GDP data for the first quarter.
Gold price edges higher amid weaker USD and softer risk tone, focus remains on US GDP

Gold price (XAU/USD) attracts some dip-buying in the vicinity of the $2,300 mark on Thursday and for now, seems to have snapped a three-day losing streak, though the upside potential seems limited.
XRP extends its decline, crypto experts comment on Ripple stablecoin and benefits for XRP Ledger

Ripple extends decline to $0.52 on Thursday, wipes out weekly gains. Crypto expert asks Ripple CTO how the stablecoin will benefit the XRP Ledger and native token XRP.
US Q1 GDP Preview: Economic growth set to remain firm in, albeit easing from Q4

The United States Gross Domestic Product (GDP) is seen expanding at an annualized rate of 2.5% in Q1. The current resilience of the US economy bolsters the case for a soft landing.