EUR/USD Current price: 1.0951
View Live Chart for the EUR/USD
Majors closed mixed this Thursday against the greenback, with the EUR giving away half of its Wednesday's gains. The pair retreated from the almost 1 month high set at 1.1042, as the dollar sell-off lost steam. There were no macroeconomic news behind the intraday decline, and the latest movement seems mostly technical, with the EUR completing a well-deserved correction, ahead of the upcoming FED meeting next week. US weekly unemployment claims resulted worse than expected, up to 282K in the week ending December 4 against previous 269K, halting the early dollar's rally.
As for the EUR/USD pair, the daily low was set at 1.0924 at the beginning of the US session, and the following bounce was contained by selling interest around 1.0975, now the immediate resistance. Short term, the 1 hour chart shows that the price remains below a bearish 20 SMA, while the technical indicators head nowhere below their mid-lines, supporting some further declines. In the 4 hours chart, the 20 SMA has extended its advance below the current level and now provides an immediate support around 1.0920, whilst the technical indicators are turning north above their mid-lines after correcting overbought readings, limiting the bearish potential at the time being.
Support levels: 1.0920 1.0880 1.0840
Resistance levels: 1.0975 1.1000 1.1045
EUR/JPY Current price: 132.95
View Live Chart for the EUR/JPY
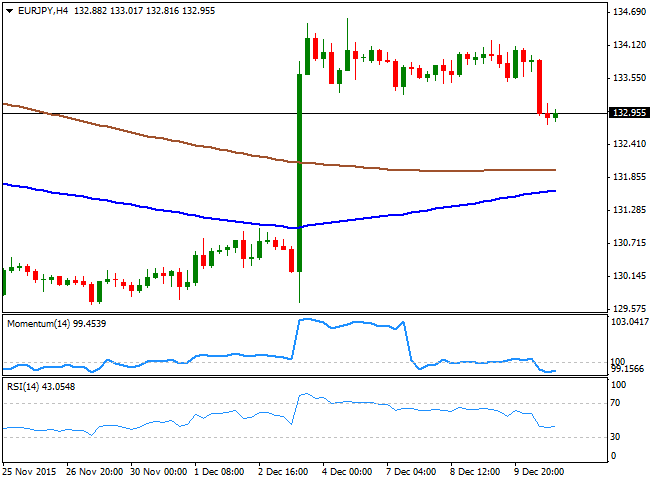
The EUR/JPY pair broke below the 133.00 level on EUR's weakness, hovering around the figure ahead of the Asian opening, and suggesting it may extend its decline given that in the daily chart, the pair faltered around a bearish 100 DMA before resuming its decline. Short term the 1 hour chart shows that the technical indicators are for the most flat below their mid-lines, and closer to oversold levels, while the price is now below the 100 SMA and above the 200 SMA, this last providing support at 132.55. In the 4 hours chart, the technical indicators have lost their bearish strength and are turning higher, but remain well below their mid-lines, limiting chances of a stronger recovery as long as the price remains below 133.30, a strong static resistance now.
Support levels: 132.55 132.10 131.70
Resistance levels: 133.30 133.75 134.20
GBP/USD Current price: 1.5124
View Live Chart for the GPB/USD
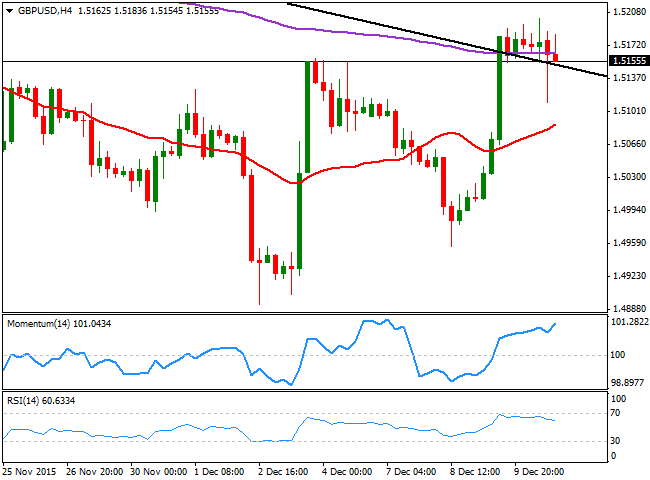
The GBP/USD pair rose to a fresh 3-week high of 1.5201 during the European morning, an ahead of the Bank of England monthly decision. But the Central Bank economic policy meeting turned out to be a fiasco, as not only officers left its policy unchanged, but the Minutes showed that policymakers are concerned over falling oil prices, which are keeping inflation subdued, while wages are hardly expected to grow from now on. The GBP/USD pair fell down to 1.5110 on the dovish tone, but managed to recover from there, and is back above the daily descendant trend line broken last Wednesday, currently at 1.5150 and the immediate support. From a technical point of view, the 1 hour chart suggests that the risk remains towards the downside as the price is below a mild bearish 20 SMA, while the technical indicators hold in negative territory, unable to recoup above their mid-lines. In the 4 hours chart, the RSI indicator heads lower from overbought levels, but the Momentum indicator turned back higher after a limited downward corrective move, while the price holds far above a bullish 20 SMA, limiting chances of a downward move, but not yet supporting a rally past the 1.5200 level.
Support levels: 1.5150 1.5110 1.5080
Resistance levels: 1.5200 1.5240 1.5285
USD/JPY Current price: 121.52
View Live Chart for the USD/JPY
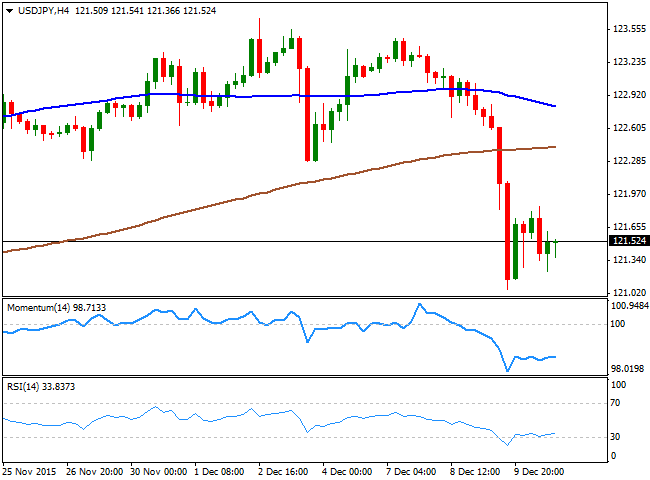
The USD/JPY closed in the red for a third day in-a-row, having, however, held within Wednesday's range. The pair has tried to recover some of the ground at the beginning of the day, but failed to do so and maintains its bearish tone, with sellers now surging on approaches to the 122.00 level. From a technical point of view, the 1 hour chart shows that the price is well below the 100 and 200 SMAs, with the shortest accelerating lower below the largest, whilst the technical indicators lack clear directional strength, but hold below their mid-lines. In the 4 hours chart, the technical indicators have turned flat near oversold territory, and after correcting the extreme readings reached earlier this week, rather reflecting the latest consolidative range than suggesting the downside potential is over. A break below the 121.00 figure is now required to confirm a new leg lower with the next bearish target then at 120.30 for this Friday.
Support levels: 121.00 120.70 120.30
Resistance levels: 121.80 122.20 122.60
AUD/USD Current price: 0.7290
View Live Chart for the AUD/USD
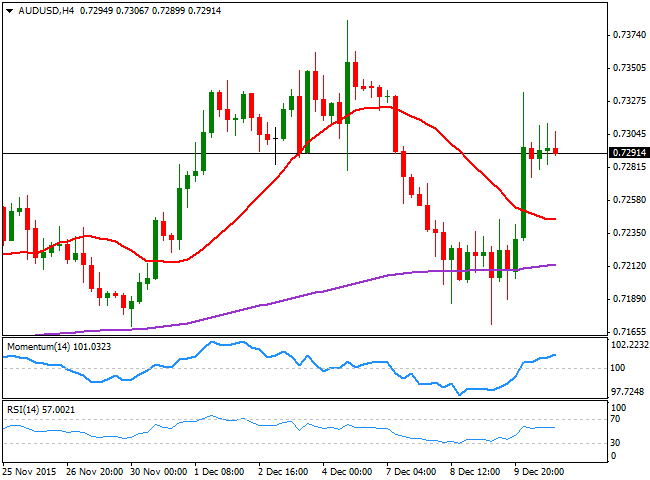
The AUD/USD pair up roared up to 0.7334, during the Asian session, following the release of much better-than-expected Australian employment data. The economy added 71,4K new jobs against a 10K decline expected after previous month sharp advance, whilst the unemployment rate shrank further, down to 5.8%, against market's expectations of a 6.0%. The pair shed some ground after the sharp rally, but holds to its gains by the end of the day, having traded around the 0.7300 level for most of the day. The technical bias is once again bullish, as in the 1 hour chart, the price holds around a sharply bullish 20 SMA while the technical indicators have corrected extreme readings and are now consolidating in positive territory. In the 4 hours chart, the price is far above the 20 SMA, while the technical indicators present tepid upward slopes above their mid-lines, in line with further advances as long as slides towards 0.7240 continue to attract buying interest.
Support levels: 0.7280 0.7240 0.7200
Resistance levels: 0.7335 0.7380 0.7415
-------
What will 2016 bring to the Forex traders? Attend our event, Forex Forecast 2016 - The Panel with Ashraf Laidi, Valeria Bednarik, Boris Schlossberg, Adam Button, Ivan Delgado and Dale Pinkert. Register for the live event on Dec. 18th and get the recording too.
-------
Information on these pages contains forward-looking statements that involve risks and uncertainties. Markets and instruments profiled on this page are for informational purposes only and should not in any way come across as a recommendation to buy or sell in these assets. You should do your own thorough research before making any investment decisions. FXStreet does not in any way guarantee that this information is free from mistakes, errors, or material misstatements. It also does not guarantee that this information is of a timely nature. Investing in Open Markets involves a great deal of risk, including the loss of all or a portion of your investment, as well as emotional distress. All risks, losses and costs associated with investing, including total loss of principal, are your responsibility. The views and opinions expressed in this article are those of the authors and do not necessarily reflect the official policy or position of FXStreet nor its advertisers. The author will not be held responsible for information that is found at the end of links posted on this page.
If not otherwise explicitly mentioned in the body of the article, at the time of writing, the author has no position in any stock mentioned in this article and no business relationship with any company mentioned. The author has not received compensation for writing this article, other than from FXStreet.
FXStreet and the author do not provide personalized recommendations. The author makes no representations as to the accuracy, completeness, or suitability of this information. FXStreet and the author will not be liable for any errors, omissions or any losses, injuries or damages arising from this information and its display or use. Errors and omissions excepted.
The author and FXStreet are not registered investment advisors and nothing in this article is intended to be investment advice.
Recommended Content
Editors’ Picks
EUR/USD retreats below 1.0700 after US GDP data

EUR/USD came under modest bearish pressure and retreated below 1.0700. Although the US data showed that the economy grew at a softer pace than expected in Q1, strong inflation-related details provided a boost to the USD.
GBP/USD declines below 1.2500 as USD rebounds

GBP/USD declined below 1.2500 and erased the majority of its daily gains with the immediate reaction to the US GDP report. The US economy expanded at a softer pace than expected in Q1 but the price deflator jumped to 3.4% from 1.8%.
Gold drops below $2,320 as US yields shoot higher

Gold lost its traction and turned negative on the day below $2,320 in the American session on Thursday. The benchmark 10-year US Treasury bond yield is up more than 1% on the day above 4.7% after US GDP report, weighing on XAU/USD.
XRP extends its decline, crypto experts comment on Ripple stablecoin and benefits for XRP Ledger

Ripple extends decline to $0.52 on Thursday, wipes out weekly gains. Crypto expert asks Ripple CTO how the stablecoin will benefit the XRP Ledger and native token XRP.
After the US close, it’s the Tokyo CPI

After the US close, it’s the Tokyo CPI, a reliable indicator of the national number and then the BoJ policy announcement. Tokyo CPI ex food and energy in Japan was a rise to 2.90% in March from 2.50%.


