EUR/USD Current price: 1.0865
View Live Chart for the EUR/USD
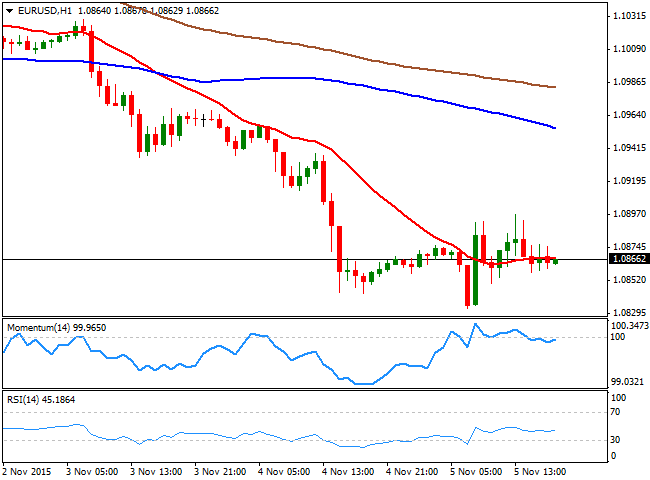
The EUR/USD pair is ending the day pretty much flat around 1.0860, having extended its decline earlier in the day down to 1.0833, a fresh 3-month low. The data released in Europe were soft, with German new orders in manufacturing in September down by 1.7% and retail sales in the EU, for the same month, decreased by 0.1%. That, alongside with a strong opening in European stocks led the common currency lower. In the US, applications for jobless benefits rose to 276K, the highest in five weeks, while the US Bureau of Labor Statistic reported that the Unit labor costs decreased 1.8% during the second quarter, rather than decreasing 1.4% as previously reported, while the preliminary reading for third quarter showed an increase of 1.4%, well below the 2.3% expected. The figures were pretty discouraging ahead of the release of US Nonfarm Payrolls this Friday, pushing investors to pause their dollar's buying.Technically, there has been no much of a change to the dominant bearish trend, given that daily basis, the pair posted a lower low and a lower high. The short term picture has turned neutral according to the 1 hour chart, as the price hovers around a flat 20 SMA, whilst the technical indicators head nowhere around their mid-lines. In the 4 hours chart, the 20 SMA presents a strong bearish slope above the current level, currently around 1.0930, while the technical indicators have corrected the extreme oversold readings reached at the beginning of the day, and remain well below their mid-lines. Nevertheless, the US employment report will set the tone during the last day of the week, regardless technical readings.
Support levels: 1.0845 1.0815 1.0770
Resistance levels: 1.0895 1.0930 1.0960
EUR/JPY Current price: 132.36
View Live Chart for the EUR/JPY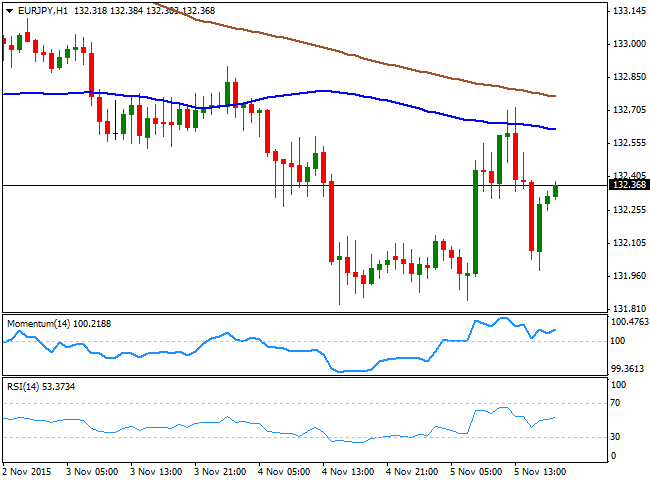
The EUR/JPY pair recovered above the 132.00 level, with the JPY getting under selling pressure during the Asian session, weighed by FED Yellen's comments regarding a possible rate hike in December, and a short lived upward corrective movement in the EUR. But the pair is far from confirming a reversal, as the 1 hour chart shows that selling interest surged on approaches to a bearish 100 SMA, currently around 132.60, while in the same chart, the technical indicators hold above their mid-lines, but lacking directional strength. In the 4 hours chart, the 100 SMA has extended further lower below the 200 SMA, both well above the current level, whilst the technical indicators present limited upward slopes in negative territory, rather reflecting the intraday advance than suggesting further gains ahead.
Support levels: 132.00 133.60 133.20
Resistance levels: 132.60 133.00 133.45
GBP/USD Current price: 1.5214
View Live Chart for the GPB/USD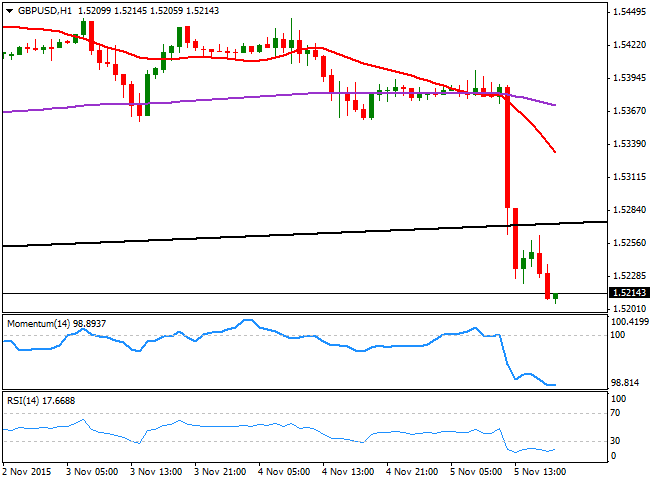
The British Pound plunged against all of its major rivals, printing a fresh 4-week low against the greenback of 1.5205, and holding nearby at the end of the day. The Bank of England surprised the market in its monthly economic meeting, by lowering their inflation and growth forecasts for this year and the next. The dovish surprise came as they expect CPI to remain below 1.0% until the second half of 2016, diminishing chances of a rate hike during the first half of the next year. Additionally, the BOE expressed its concerns over an expensive Pound weighing on inflation-growth. The pair broke lower, taking away a daily ascendant trend line coming from October low of 1.5106 and the 1 hour chart shows that the 20 SMA has turned sharply lower far above the current level, whilst the technical indicators have lost their downward strength, but remain in extreme oversold territory. In the 4 hours chart, the technical picture is quite similar, as the technical indicators hold in oversold levels, with no signs of changing bias in the short term. The broken trend line stands at 1.5300 for this Friday, and a pullback to it can be disregarded, particularly if US employment data misses expectations, but further gains seem unlikely now for the Pound.
Support levels: 1.5205 1.5160 1.5110
Resistance levels: 1.5260 1.5300 1.5345
USD/JPY Current price: 121.73
View Live Chart for the USD/JPY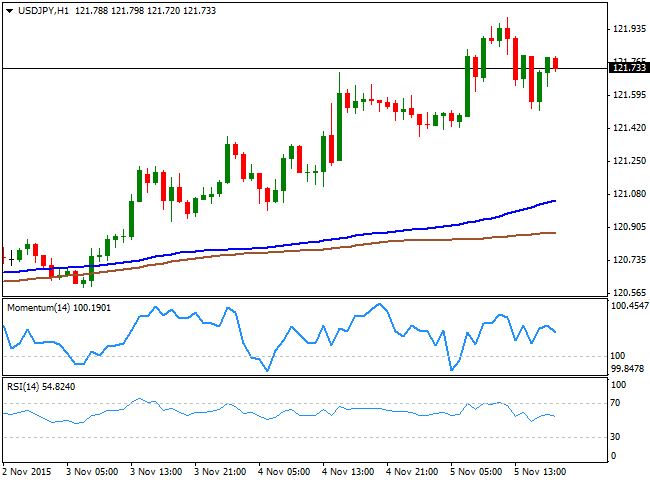
The USD/JPY rallied up to 121.99 this Thursday, as the dollar's momentum triggered by the FED's head extended during the Asian session, although weaker-than-expected US employment data stalled the rally. The pair corrected down to 121.51 intraday, meeting some buying interest around its 200 DMA, and ends the day also above the 100 DMA, a few pips above the largest. Short term, the 1 hour chart shows that the technical indicators have turned lower, but hold above their mid-lines, whilst the price stands well above its 100 and 200 SMAs, in the 120.80/121.10 region. In the 4 hours chart, the technical indicators have retreated from overbought levels before resuming their advances, whilst the moving averages are slowly advancing well below the current level, all of which supports additional gains ahead, at least, from a technical point of view.
Support levels: 121.50 121.15 120.90
Resistance levels: 122.05 122.50 122.90
AUD/USD Current price: 0.7144
View Live Chart for the AUD/USD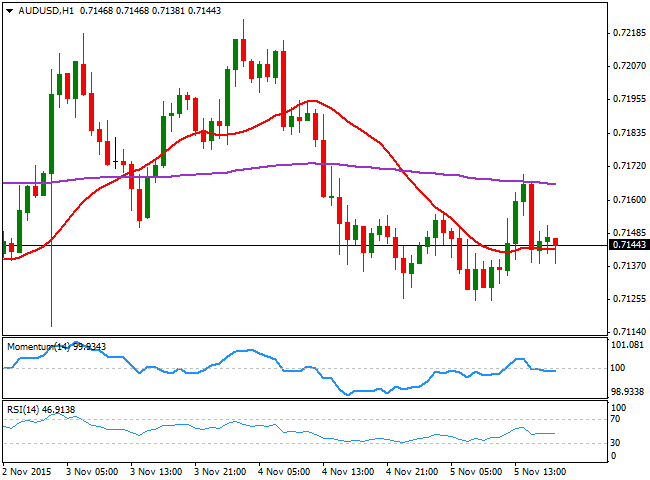
The Aussie posted a tepid intraday advance against the greenback, following poor US employment readings, but erased most of its daily gains, ending the day barely above its opening level. Early Friday, the RBA will release the Minutes of its latest economic policy meeting, and investors will be looking there for clues on a possible rate cut for the upcoming months, albeit seems unlikely that the Central Bank will move before the year end. The short term technical picture has turned neutral, as the 1 hour chart shows that the price is moving back and forth around a horizontal 20 SMA, whilst the technical indicators remain stuck around their mid-lines. In the 4 hours chart, the early advance was contained by a flat 20 SMA, whilst the technical indicators present tepid bullish slopes below their mid-lines, still far from suggesting additional gains ahead. The daily low was set at 0.7125, although a break below 0.7110 is required to confirm a bearish continuation for this Friday, down towards the 0.7030 price zone.
Support levels: 0.7110 0.7075 0.7030
Resistance levels: 0.7160 0.7195 0.7240
Information on these pages contains forward-looking statements that involve risks and uncertainties. Markets and instruments profiled on this page are for informational purposes only and should not in any way come across as a recommendation to buy or sell in these assets. You should do your own thorough research before making any investment decisions. FXStreet does not in any way guarantee that this information is free from mistakes, errors, or material misstatements. It also does not guarantee that this information is of a timely nature. Investing in Open Markets involves a great deal of risk, including the loss of all or a portion of your investment, as well as emotional distress. All risks, losses and costs associated with investing, including total loss of principal, are your responsibility. The views and opinions expressed in this article are those of the authors and do not necessarily reflect the official policy or position of FXStreet nor its advertisers. The author will not be held responsible for information that is found at the end of links posted on this page.
If not otherwise explicitly mentioned in the body of the article, at the time of writing, the author has no position in any stock mentioned in this article and no business relationship with any company mentioned. The author has not received compensation for writing this article, other than from FXStreet.
FXStreet and the author do not provide personalized recommendations. The author makes no representations as to the accuracy, completeness, or suitability of this information. FXStreet and the author will not be liable for any errors, omissions or any losses, injuries or damages arising from this information and its display or use. Errors and omissions excepted.
The author and FXStreet are not registered investment advisors and nothing in this article is intended to be investment advice.
Recommended Content
Editors’ Picks
EUR/USD fluctuates near 1.0700 after US data

EUR/USD stays in a consolidation phase at around 1.0700 in the American session on Wednesday. The data from the US showed a strong increase in Durable Goods Orders, supporting the USD and making it difficult for the pair to gain traction.
USD/JPY refreshes 34-year high, attacks 155.00 as intervention risks loom

USD/JPY is renewing a multi-decade high, closing in on 155.00. Traders turn cautious on heightened risks of Japan's FX intervention. Broad US Dollar rebound aids the upside in the major. US Durable Goods data are next on tap.
Gold keeps consolidating ahead of US first-tier figures

Gold finds it difficult to stage a rebound midweek following Monday's sharp decline but manages to hold above $2,300. The benchmark 10-year US Treasury bond yield stays in the green above 4.6% after US data, not allowing the pair to turn north.
Worldcoin looks set for comeback despite Nvidia’s 22% crash Premium

Worldcoin price is in a better position than last week's and shows signs of a potential comeback. This development occurs amid the sharp decline in the valuation of the popular GPU manufacturer Nvidia.
Three fundamentals for the week: US GDP, BoJ and the Fed's favorite inflation gauge stand out Premium

While it is hard to predict when geopolitical news erupts, the level of tension is lower – allowing for key data to have its say. This week's US figures are set to shape the Federal Reserve's decision next week – and the Bank of Japan may struggle to halt the Yen's deterioration.
