EUR/USD Current price: 1.0965
View Live Chart for the EUR/USD
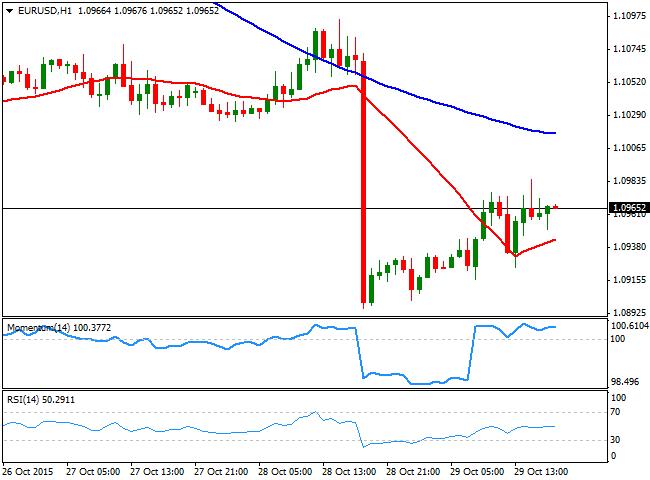
The American dollar closed mixed this Thursday, having however, held near its recent highs against most of its rivals. The macroeconomic front was pretty busy, but majors saw limited reactions to the news. Starting with Europe, the region released its confidence figures for October, with main reading resulting at -7.7, matching September number. In Germany, unemployment fell in October, by seasonally adjusted 5K to 2.788 million, while inflation in the same month, rose 0.3% compared to a year before. In the US, the advanced GDP reading for the Q3, came out at 1.5% slightly below the 1.6% expected. Weekly unemployment claims, in the week ending October 23rd, resulted at 260K better than the 263K expected. Worse news came from the housing sector, as Pending Home sales in September declined 2.3%.The EUR/USD pair posted a daily high of 1.0985 after in the American afternoon and following soft data, ending the day with some gains around 1.0965. The short term picture however, is far from supporting additional gains, as in the 1 hour chart, the technical indicators have turned flat after recovering above their mid-lines, whilst the price remains well below a bearish 100 SMA. In the 4 hours chart, the technical indicators are heading slightly lower well into negative territory, while the 20 SMA maintains its bearish tone, offering an immediate resistance around 1.1015. Being the last day of the month, investors may take some profits out of the table this Friday although sellers will likely add at higher levels.
Support levels: 1.0920 1.0880 1.0840
Resistance levels: 1.1015 1.1050 1.1090
EUR/JPY Current price: 132.79
View Live Chart for the EUR/JPY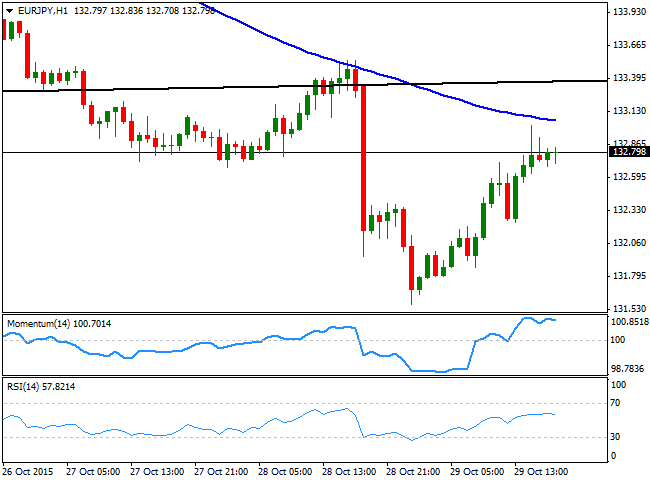
The EUR/JPY managed to recover some ground amid a weakening JPY and the EUR upward corrective move, although the pair was unable to regain the 133.00 level. Despite stocks closed generally lower across the world, investors chose to sell the Japanese currency, ahead of the BOJ meeting at the beginning of the Asian session, in which the Central Bank is expected to announce an extension of its ongoing stimulus program. Technically and in the short term, the 1 hour chart shows that the price stalled below a strongly bearish 100 SMA, whilst the Momentum indicator turned flat in overbought territory, and the RSI indicator lacks directional strength around 58. In the 4 hours chart, the technical indicators have managed to correct the extreme oversold readings, but are losing their upward momentum below their mid-lines, whilst the price is far below its moving averages, all of which maintains the risk towards the downside.
Support levels: 132.60 132.30 131.90
Resistance levels: 133.10 133.50 134.00
GBP/USD Current price: 1.5310
View Live Chart for the GPB/USD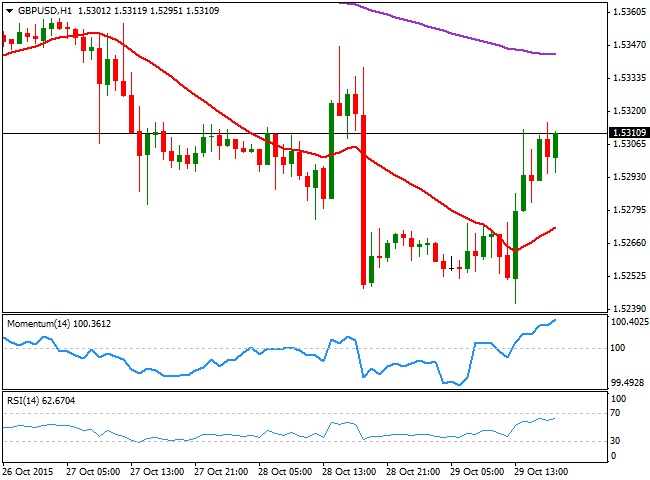
The GBP/USD pair recovered some ground after extending its decline to a fresh 2-week low of 1.5241, ending the day a handful of pips above the 1.5300 figure. Soft US readings gave the pair a boost during the American afternoon, despite macroeconomic readings in the UK also were tepid. Money Supply data in the UK, showed that business lending decreased in October, whist mortgage lending came out at 68.874K against previous 71.03K. The recovery was enough to reverse the short term picture, although the dominant trend is still bearish, given that the pair is trading below a daily descendant trend line coming from October 23rd daily high. The 1 hour chart shows that the price is now above a bullish 20 SMA, whilst the technical indicators maintain their sharp bullish slopes near overbought territory. In the 4 hours chart, the technical indicators have advanced below their mid-lines, but remain in negative territory, whilst the price is struggling around a bearish 20 SMA.
Support levels: 1.5280 1.5245 1.5200
Resistance levels: 1.5325 1.5360 1.5400
USD/JPY Current price: 121.13
View Live Chart for the USD/JPY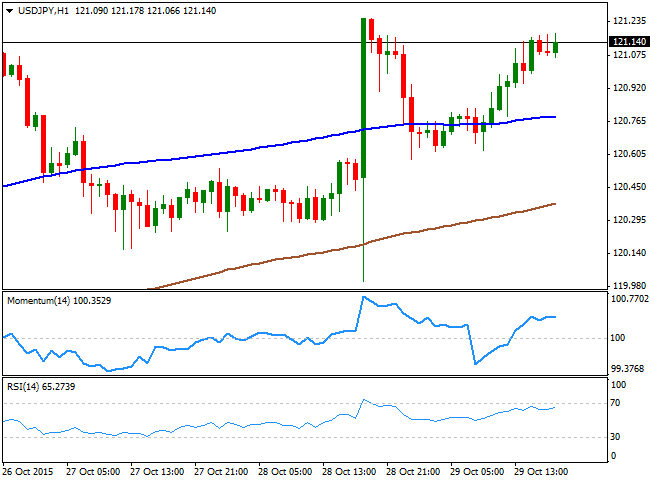
The USD/JPY pair regained the 121.00 level ahead of the Asian opening, as investors are waiting for the upcoming Bank of Japan economic policy decision. The market has been eyeing this particular meeting as the country will also release its half-year forecast, which will give a clearer picture of the economic situation, and therefore if it needs or not, additional QE. Anyway, if the BOJ announces an expansion of its facility program, the pair will likely rally, although notice that the movement has been largely priced in. An on-hold stance on the other hand, may trigger a more interesting bearish move. Technically, the 1 hour chart shows that the price is holding well above its 100 SMA while the technical indicators have lost their upward strength near overbought territory, in line with further gains. In the 4 hours chart, the outlook also favors the upside, with the Momentum indicator still heading higher well above its 100 level and the RSI holding around 59.
Support levels: 121.00 120.70 120.30
Resistance levels: 121.40 121.75 122.10
AUD/USD Current price: 0.7076
View Live Chart for the AUD/USD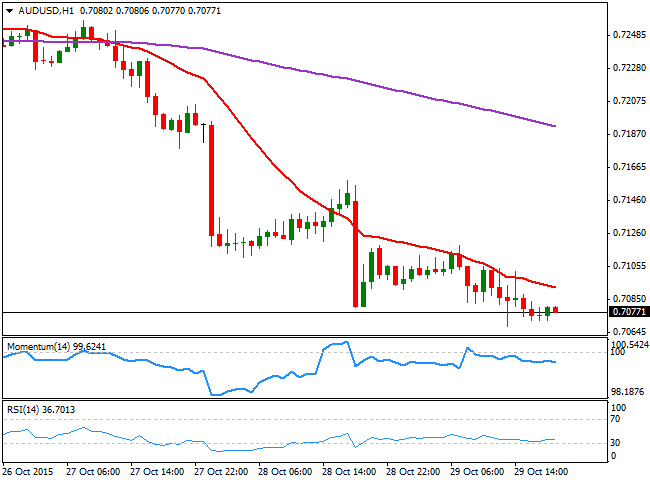
The AUD/USD pair extended its decline to a 3-week low of 0.7068 holding nearby by the end of the day, and maintaining the negative tone seen on the previous updates. The Aussie was weighed by a sharp decline in gold prices, but also due to the latest inflation readings, which fueled speculation that the RBA will have to cut rates at least one more time before the year end. Trading below the 0.7200 level, the 1 hour chart shows that the technical readings are biased lower, with the indicators heading south below their mid-lines and the 20 SMA capping the upside around 0.7080. In the 4 hours chart, the 20 SMA has accelerated its decline well above the current level, whilst the technical indicators maintain tepid bearish slopes in oversold territory, all of which points for further declines ahead.
Support levels: 0.7035 0.6990 0.6955
Resistance levels: 0.7125 0.7160 0.7195
Information on these pages contains forward-looking statements that involve risks and uncertainties. Markets and instruments profiled on this page are for informational purposes only and should not in any way come across as a recommendation to buy or sell in these assets. You should do your own thorough research before making any investment decisions. FXStreet does not in any way guarantee that this information is free from mistakes, errors, or material misstatements. It also does not guarantee that this information is of a timely nature. Investing in Open Markets involves a great deal of risk, including the loss of all or a portion of your investment, as well as emotional distress. All risks, losses and costs associated with investing, including total loss of principal, are your responsibility. The views and opinions expressed in this article are those of the authors and do not necessarily reflect the official policy or position of FXStreet nor its advertisers. The author will not be held responsible for information that is found at the end of links posted on this page.
If not otherwise explicitly mentioned in the body of the article, at the time of writing, the author has no position in any stock mentioned in this article and no business relationship with any company mentioned. The author has not received compensation for writing this article, other than from FXStreet.
FXStreet and the author do not provide personalized recommendations. The author makes no representations as to the accuracy, completeness, or suitability of this information. FXStreet and the author will not be liable for any errors, omissions or any losses, injuries or damages arising from this information and its display or use. Errors and omissions excepted.
The author and FXStreet are not registered investment advisors and nothing in this article is intended to be investment advice.
Recommended Content
Editors’ Picks
AUD/USD holds hot Australian CPI-led gains above 0.6500

AUD/USD consolidates hot Australian CPI data-led strong gains above 0.6500 in early Europe on Wednesday. The Australian CPI rose 1% in QoQ in Q1 against the 0.8% forecast, providing extra legs to the Australian Dollar upside.
USD/JPY sticks to 34-year high near 154.90 as intervention risks loom

USD/JPY is sitting at a multi-decade high of 154.88 reached on Tuesday. Traders refrain from placing fresh bets on the pair as Japan's FX intervention risks loom. Broad US Dollar weakness also caps the upside in the major. US Durable Goods data are next on tap.
Gold price struggles to lure buyers amid positive risk tone, reduced Fed rate cut bets

Gold price lacks follow-through buying and is influenced by a combination of diverging forces. Easing geopolitical tensions continue to undermine demand for the safe-haven precious metal. Tuesday’s dismal US PMIs weigh on the USD and lend support ahead of the key US macro data.
Crypto community reacts as BRICS considers launching stablecoin for international trade settlement

BRICS is intensifying efforts to reduce its reliance on the US dollar after plans for its stablecoin effort surfaced online on Tuesday. Most people expect the stablecoin to be backed by gold, considering BRICS nations have been accumulating large holdings of the commodity.
US versus the Eurozone: Inflation divergence causes monetary desynchronization

Historically there is a very close correlation between changes in US Treasury yields and German Bund yields. This is relevant at the current juncture, considering that the recent hawkish twist in the tone of the Fed might continue to push US long-term interest rates higher and put upward pressure on bond yields in the Eurozone.
