EUR/USD Current price: 1.1440
View Live Chart for the EUR/USD

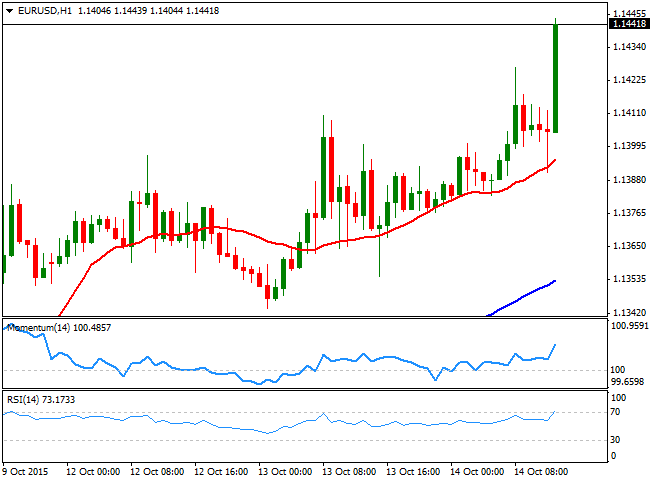
Markets are replicating Tuesday's behavior today, with risk aversion dominating the Asian session, European equities opening lower, and the EUR/USD pair advancing to a fresh high of 1.1427, but unable to rally. During the European morning, macroeconomic data showed that Industrial Production in the EU fell by 0.5% in August, whilst inflation readings in Italy, France and Spain, all came out negative, although failed to affect the market. Early US session, the country released is PPI figures for September which resulted much worse-than expected, down yearly basis by 1.1%, whilst the core reading ex Food & Energy came out at 0.8%, from previous 0.9% and against 1.2% expected. Retail Sales during the same month, grew by 0.1% monthly basis, with the core reading down 0.3%, also disappointing investors.
The EUR/USD pair extended its advance beyond the 1.1440 level, and the short term picture supports additional gains, given that the price met intraday buying interest on pullbacks towards a bullish 20 SMA, whilst the technical indicators head sharply higher above their mid-lines. In the 4 hours chart, the technical picture is also bullish, despite the RSI indicator stands in extreme overbought levels. The pair has a strong midterm resistance in the 1.1460 region, and will likely find some selling interest around it, yet a break above it should lead to a steady advance towards the 1.1500 region during the upcoming hours.
Support levels: 1.1420 1.1480 1.1340
Resistance levels: 1.1460 1.1500 1.1540
GBP/USD Current price: 1.5415
View Live Chart for the GPB/USD
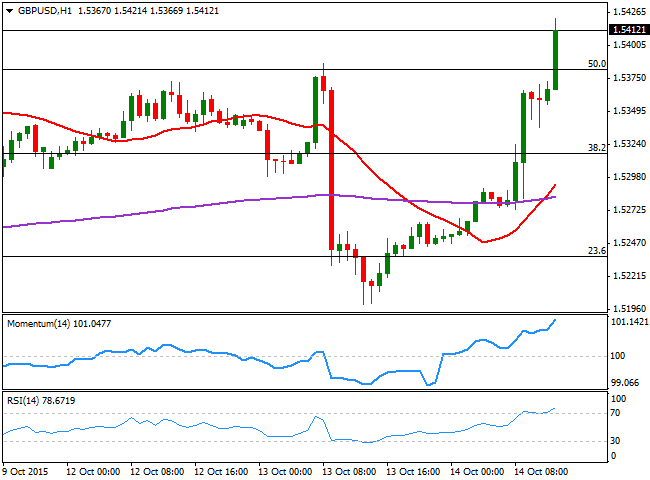
The GBP/USD pair reversed its Tuesday's losses and erased almost all of its latest losses, on the back on a mixed UK employment report that showed that the unemployment rate fell to its lowest since 2008, whilst wages continued to grow during September, although below expectations. Also, more people filled for unemployment benefits, but overall, the data put the BOE's back in the raising rates path. The pair advanced up to 1.1.5380 before the release of the US data, breaking higher afterwards, standing now at fresh highs above the 1.5400 level. Technically bullish, the 1 hour chart shows that the technical indicators head sharply higher in extreme overbought territory, with no aims of changing bias and favoring a continued advance during the US session. In the 4 hours chart, the price is well above its moving averages, whilst the technical indicators maintain their bullish slopes above their mid-lines, in line with the shorter term outlook.
Support levels: 1.5380 1.5345 1.5310
Resistance levels: 1.5425 1.5460 1.5500
USD/JPY Current price: 119.35
View Live Chart for the USD/JPY
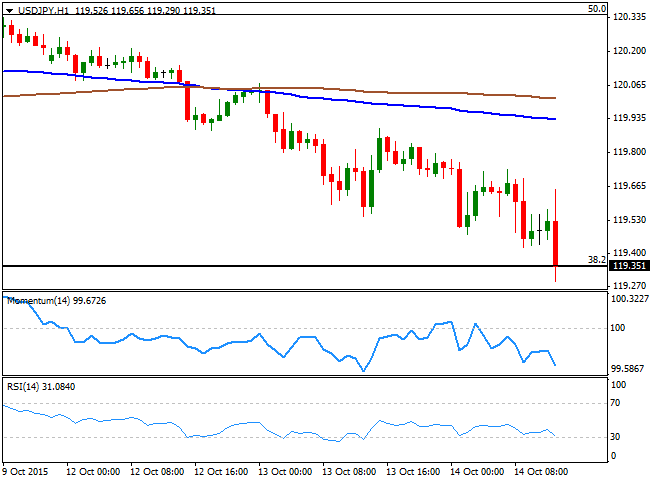
Breaking lower, watch 118.55. The USD/JPY pair extended its slow, but steady decline this Wednesday, down to 119.42 amid poor Chinese inflation figures. The CPI for September came out at 0.1% monthly basis, against expectations of a 0.5% advance, whilst yearly basis, it resulted at 1.6% from the previous 2.0%. The producer price index in the same month, declined by 5.9%, matching the previous reading. The pair bounced some ahead of US data, as stocks recovered from their lows, but plunged with poor US inflation and retail sales reading, now struggling around a critical Fibonacci support, the 38.2% retracement of its latest daily fall. The 1 hour chart suggest the decline may now extend, as the technical indicators head sharply lower below their mid-lines, whilst the price extended further below its moving averages. In the 4 hours chart, the picture is pretty much the same, with the technical indicators heading sharply lower near oversold levels. A break below 118.90 will likely see the price testing the base of its latest range around 118.50/60, whilst a break below this last should confirm a midterm bearish continuation towards the 116.60 price zone.
Support levels: 118.90 118.55 118.10
Resistance levels: 119.70 120.05 120.35
AUD/USD Current price: 0.7275
View Live Chart for the AUD/USD
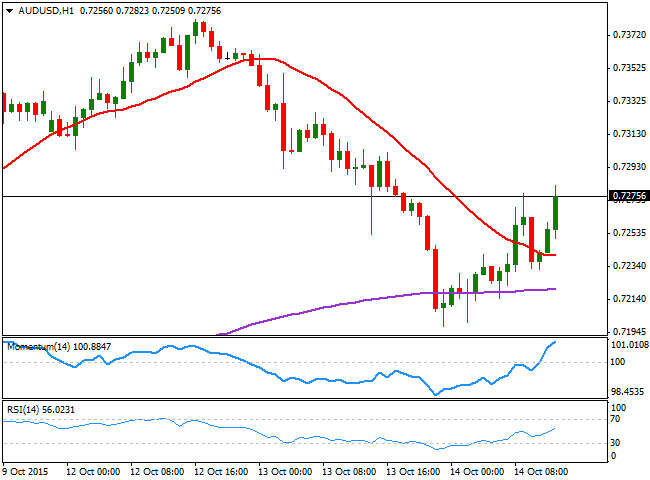
The AUD/USD pair fell briefly below the 0.7200 level, on the back of poor Chinese data fueling risk aversion, but speculative buying interest helped the pair bouncing back up to 0.7277 early in the European session. The 1 hour chart shows that the price is now pressuring the mentioned high, above its 20 SMA and with the technical indicators heading north in positive territory, all of which supports a continued advance. In the 4 hours chart however, the price remains below a bearish 20 SMA, whilst the technical indicators head higher, but below their mid-lines, suggesting additional gains beyond 0.7310 are required to confirm a new leg higher.
Support levels: 0.7250 0.7220 0.7175
Resistance levels: 0.7310 0.7350 0.7390
Information on these pages contains forward-looking statements that involve risks and uncertainties. Markets and instruments profiled on this page are for informational purposes only and should not in any way come across as a recommendation to buy or sell in these assets. You should do your own thorough research before making any investment decisions. FXStreet does not in any way guarantee that this information is free from mistakes, errors, or material misstatements. It also does not guarantee that this information is of a timely nature. Investing in Open Markets involves a great deal of risk, including the loss of all or a portion of your investment, as well as emotional distress. All risks, losses and costs associated with investing, including total loss of principal, are your responsibility. The views and opinions expressed in this article are those of the authors and do not necessarily reflect the official policy or position of FXStreet nor its advertisers. The author will not be held responsible for information that is found at the end of links posted on this page.
If not otherwise explicitly mentioned in the body of the article, at the time of writing, the author has no position in any stock mentioned in this article and no business relationship with any company mentioned. The author has not received compensation for writing this article, other than from FXStreet.
FXStreet and the author do not provide personalized recommendations. The author makes no representations as to the accuracy, completeness, or suitability of this information. FXStreet and the author will not be liable for any errors, omissions or any losses, injuries or damages arising from this information and its display or use. Errors and omissions excepted.
The author and FXStreet are not registered investment advisors and nothing in this article is intended to be investment advice.
Recommended Content
Editors’ Picks
GBP/USD stays weak near 1.2400 after UK Retail Sales data

GBP/USD stays vulnerable near 1.2400 early Friday, sitting at five-month troughs. The UK Retail Sales data came in mixed and added to the weakness in the pair. Risk-aversion on the Middle East escalation keeps the pair on the back foot.
EUR/USD extends its downside below 1.0650 on hawkish Fed remarks

The EUR/USD extends its downside around 1.0640 after retreating from weekly peaks of 1.0690 on Friday. The hawkish comments from Federal Reserve officials provide some support to the US Dollar.
Gold: Middle East war fears spark fresh XAU/USD rally, will it sustain?

Gold price is trading close to $2,400 early Friday, reversing from a fresh five-day high reached at $2,418 earlier in the Asian session. Despite the pullback, Gold price remains on track to book the fifth weekly gain in a row.
Bitcoin Price Outlook: All eyes on BTC as CNN calls halving the ‘World Cup for Bitcoin’

Bitcoin price remains the focus of traders and investors ahead of the halving, which is an important event expected to kick off the next bull market. Amid conflicting forecasts from analysts, an international media site has lauded the halving and what it means for the industry.
Israel vs. Iran: Fear of escalation grips risk markets

Recent reports of an Israeli aerial bombardment targeting a key nuclear facility in central Isfahan have sparked a significant shift out of risk assets and into safe-haven investments.