EUR/USD Current price: 1.1238
View Live Chart for the EUR/USD
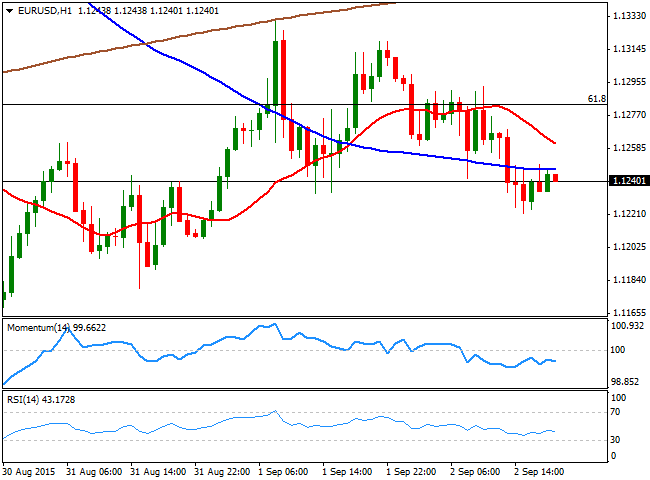
The American dollar ended the day mixed against its rivals, as investors traded on relief, with Asian share markets quieter than usual. The Shanghai Composite closed 0.2% lower, and China will have a holiday this Thursday, having no saying in what's next for currencies. Investors however, remained cautious as the ECB will have its economic policy meeting during the upcoming European session, whilst the US will release its monthly employment figures next Friday. As for the first, the ECB is generally expected to present a dovish stance, acknowledging the current low inflation levels, by downgrading its forecast, and even reiterate its willingness to extend the ongoing QE. The statement may play negatively on the EUR, but markets will likely wait until US employment figures to decide clear trends, as the possibility of a US September rake hike can well be determinate by the report.
The EUR/USD pair fell down to 1.1221, despite the US ADP survey missed expectations for August, as the private sector added 190K against a 200K forecast, with the greenback finding support in Wall Street's recovery. By the end of the day, the pair has remained confined within a tight range near the mentioned low, presenting a neutral-to-bearish short term stance, as the 1 hour chart shows that the price is below a bearish 20 SMA whilst the technical indicators head slightly lower, barely below their mid-lines. In the 4 hours chart, however, the price is moving back and forth around a horizontal 20 SMA, whilst the technical indicators are aiming to bounce from their mid-lines, lacking directional strength. Additional declines below 1.1210 should favor a bearish extension, down to 1.1120 should the dollar remain on demand after the ECB.
Support levels: 1.1210 1.1160 1.1120
Resistance levels: 1.1280 1.1330 1.1370
EUR/JPY Current Price: 135.04
View Live Chart for the EUR/JPY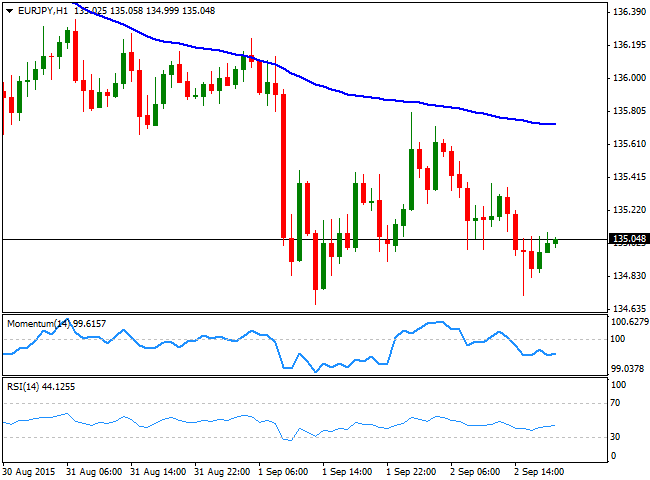
The EUR/JPY pair remained under pressure, with the pair having traded within Tuesday's range and closing the day pretty much flat around 135.00. The heavy tone in the pair is still quite clear daily basis, with the price falling further below its 100 DMA, currently around 136.60, a line in the sand for the upcoming days, as some strength above it can favor additional recoveries. Short term, the 1 hour chart shows that there's little buying interest around, as the technical indicators hold flat well into negative territory, and the price far below its moving averages. In the 4 hours chart, the technical indicators have turned slightly higher, but remain well below their mid-lines, as the price is relatively close to its weekly low at 134.66, from where the pair bounced again this Wednesday. The risk remains towards the downside, with a break below 134.60 confirming a bearish continuation towards the 133.50 price zone for the upcoming sessions.
Support levels: 134.60 134.10 133.50
Resistance levels: 135.25 135.70 136.20
GBP/USD Current price: 1.5315
View Live Chart for the GPB/USD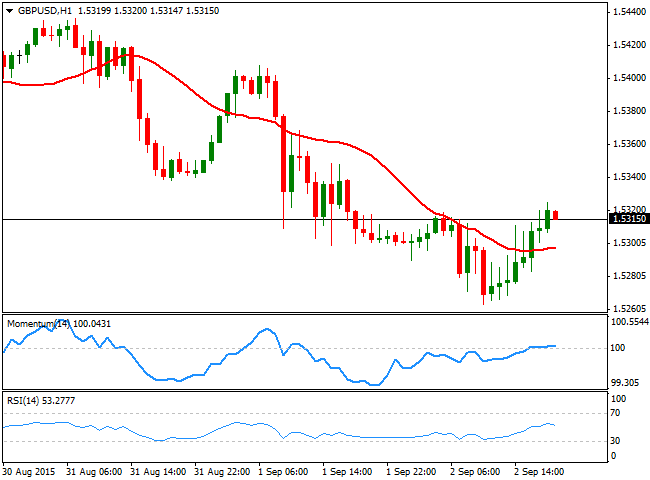
The British Pound finally put a green candle against the greenback, snapping a 6-day steady decline. Nevertheless, the daily chart shows that the pair has set a lower low and a lower high, which suggest the recovery is mostly corrective than a confirmed bottom. The pair fell to a fresh 3-month low of 1.5253 during the European session, following the release of Britain's Markit Construction PMI for August that resulted at 57.3 against expectations of 57.5 and previous 57.1. The short term technical outlook, however, is far from suggesting the intraday rally may extend, as the 1 hour chart shows that the price is barely above a horizontal 20 SMA, whilst the Momentum indicator holds flat around its 100 level and the RSI indicator turns lower around 53. In the 4 hours chart the 20 SMA is partially losing its bearish strength, but heads lower around 1.5360, providing a strong intraday resistance, whilst the Momentum indicator heads higher below the 100 level and the RSI indicator bounces from oversold levels, but is also far from supporting a continued advance.
Support levels: 1.5290 1.5250 1.5220
Resistance levels: 1.5330 1.5360 1.5400
USD/JPY Current price: 120.17
View Live Chart for the USD/JPY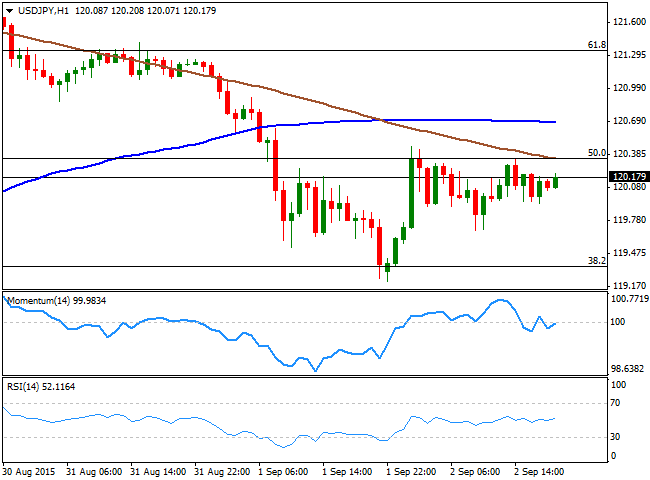
The USD/JPY pair advanced modestly this Wednesday, managing to close the day above the 120.00 level. An early advance was contained around the 50% retracement on its last two weeks decline, still the level to break to confirm a stronger advance. Anyway, the USD/JPY tends to remain range bound ahead of US Nonfarm Payroll data, which means little should be expected for this Thursday. Short term, the pair maintains a neutral-to-bearish tone, as in the 1 hour chart, the pair is also below its 100 and 200 SMAs, whilst the technical indicators are hovering around their mid-lines. In the 4 hours chart, the technical picture supports a continued decline, as the moving averages extended their bearish slopes well above the current price, whilst the Momentum indicator is turning back south below its 100 level, and the RSI indicator hovers around 46. To confirm a more sustainable decline, the pair needs to break below 119.35, 61.8% retracement of the same rally.
Support levels: 119.80 119.35 118.90
Resistance levels: 120.35 120.60 121.00
AUD/USD Current price: 0.7045
View Live Chart for the AUD/USD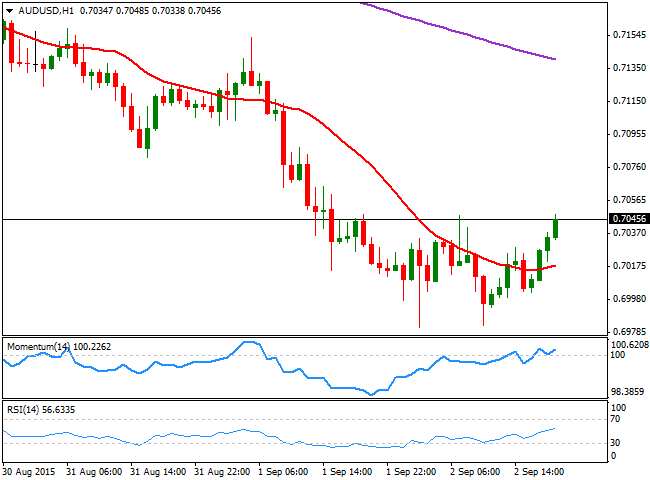
The AUD/USD pair surged in the American afternoon, after reaching a fresh 6-year low of 0.6981 earlier in the day. The decline was triggered by Australian GDP readings for the second quarter of this 2015, down to 0.2% against previous 0.9% and expectations of 0.4%. The ongoing recovery seems more corrective than a confirmation of further gains, as the pair remains well below its weekly opening, and with the daily chart showing that it continues to post lower lows and lower highs. The 1 hour chart shows that the price stands now above its 20 SMA, whilst the technical indicators present a tepid upward potential above their mid-lines, although lacking momentum at the time being. In the 4 hours chart, the 20 SMA maintains a strong bearish slope, providing a dynamic resistance around 0.7100, whilst the technical indicators are now bouncing from oversold levels, but remain well below their mid-lines. A recovery above the 0.7100 level should favor additional intraday gains, but selling interest will likely resume on an approach to the 0.7200 price zone.
Support levels: 0.6980 0.6950 0.6915
Resistance levels: 0.7070 0.7100 0.7140
Recommended Content
Editors’ Picks
EUR/USD stays below 1.0700 ahead of US data

EUR/USD stays in a consolidation phase slightly below 1.0700 in the European session on Wednesday. Upbeat IFO sentiment data from Germany helps the Euro hold its ground as market focus shifts to US Durable Goods Orders data.
USD/JPY refreshes 34-year high, attacks 155.00 as intervention risks loom

USD/JPY is renewing a multi-decade high, closing in on 155.00. Traders turn cautious on heightened risks of Japan's FX intervention. Broad US Dollar rebound aids the upside in the major. US Durable Goods data are next on tap.
Gold manages to hold above $2,300

Gold struggles to stage a rebound following Monday's sharp decline but manages to hold above $2,300. The benchmark 10-year US Treasury bond yield stays in the green above 4.6% ahead of US data, not allowing XAU/USD to gain traction.
Worldcoin looks set for comeback despite Nvidia’s 22% crash Premium

Worldcoin price is in a better position than last week's and shows signs of a potential comeback. This development occurs amid the sharp decline in the valuation of the popular GPU manufacturer Nvidia.
Three fundamentals for the week: US GDP, BoJ and the Fed's favorite inflation gauge stand out Premium

While it is hard to predict when geopolitical news erupts, the level of tension is lower – allowing for key data to have its say. This week's US figures are set to shape the Federal Reserve's decision next week – and the Bank of Japan may struggle to halt the Yen's deterioration.