EUR/USD Current price: 1.1291
View Live Chart for the EUR/USD
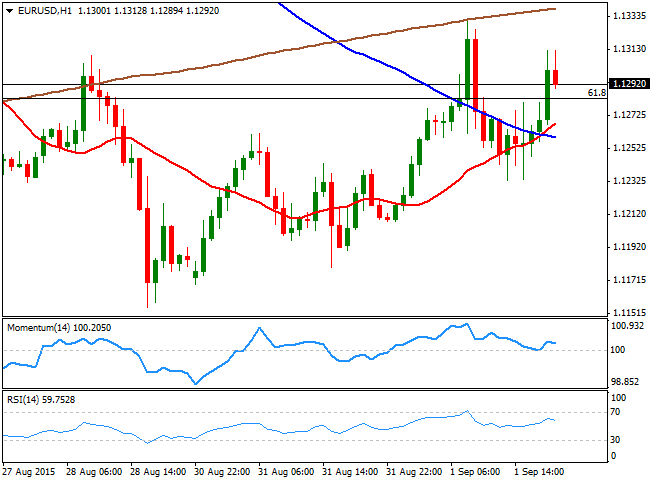
The EUR/USD aims to close the day around the 1.1300 level, having got help from renewed worldwide stocks slides. Equities come under pressure in Asia, following the release of poor Chinese manufacturing data, as the Caixin Markit PMI fell within contraction levels in for a second month in a row. The Shanghai Composite closed once again the red, driven European and American stocks lower, on fears the economic crunch of China will spread among other major economies.
In Europe, German manufacturing improved at its fastest pace in 16 months during August, with the local PMI rising from July’s 51.8 to 53.3. In France and Germany, the manufacturing sector deteriorated again in August, which resulted in an overall EU reading of 52.3, slightly below expected. In the US, the ISM Manufacturing PMI also missed expectations, printing 51.1 in August, against previous 52.7. The lack of encouraging data to revert market sentiment, maintains investors in risk-off mode.
As for the technical picture, the EUR/USD pair traded higher in range, having reached 1.1331 with the European opening, and finding intraday buying interest on a dip to 1.1232, the US session low. The pair remains quite choppy ahead of the ECB meeting and the US Payrolls release later on this week, with little room for strong directional moves. Short term, a mild positive tone prevails as the 20 SMA heads lower below the current price, whilst the pair holds above 1.1280, the 61.8% retracement of its latest bullish run. In the 4 hours chart, the upside is also favored, with the indicators heading north around their mid-lines, and the 20 SMA providing support around the mentioned session low.
Support levels: 1.1280 1.1235 1.1180
Resistance levels: 1.1330 1.1370 1.1410
EUR/JPY Current Price: 135.28
View Live Chart for the EUR/JPY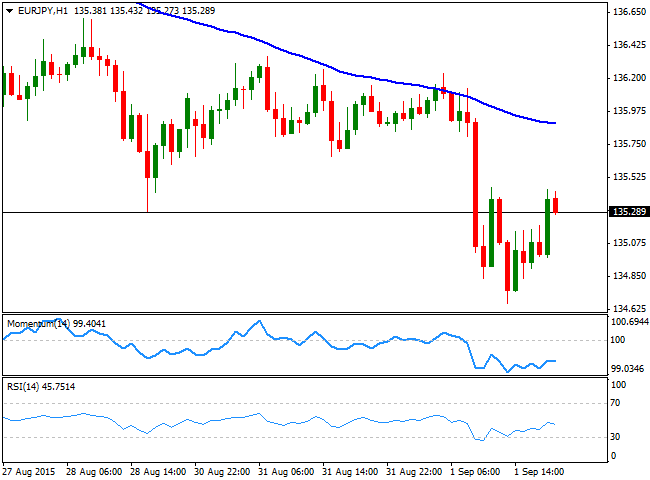
The EUR/JPY sunk to a fresh 6-week low of 134.66, as the yen soared on safe-haven demand, resuming its latest bullish trend, also helped by falling stocks. The 1 hour chart shows that the price failed to advance above its 100 SMA earlier in the day, accelerating its decline afterwards. In the same chart, the technical indicators maintain a negative tone below their mid-lines, although lack directional strength at the time being. In the 4 hours chart the technical indicators are bouncing alongside with the price, but remain well below their mid-lines, whilst the price is further below its moving averages, all of which maintains the risk towards the downside.
Support levels: 134.90 134.45 134.00
Resistance levels: 135.70 136.20 136.65
GBP/USD Current price: 1.5316
View Live Chart for the GPB/USD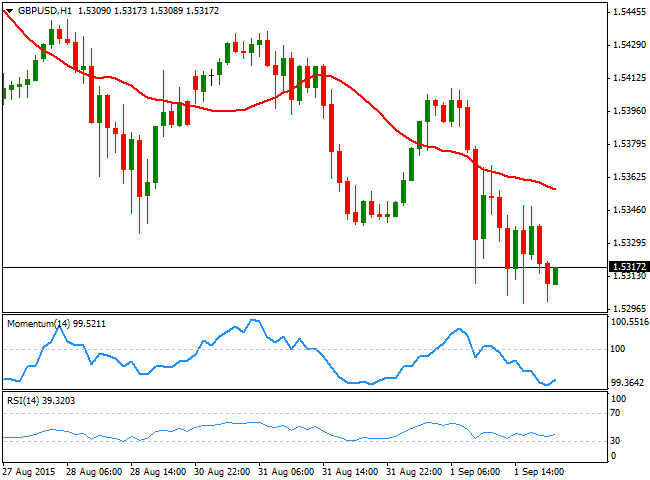
The GBP/USD pair closes the day at its lowest level in 3-months, having been as low as 1.5299 during the American afternoon. The Pound was weighed by the poor performance of the UK manufacturing sector, as the August PMI dipped to 51.5 from previous 51.9, whilst Britain's broad money, M4, increased by £8.4B in July, compared to the average monthly increase of £5.1 billion over the previous six months, all of which suggest the economic recovery is starting to slowdown. Additionally, the GBP was unable to attract buyers on a risk aversion environment, and seems poised to extend its decline during the upcoming sessions, as the 1 hour chart shows that the 20 SMA maintains a clear bearish slope above the current level, whilst the technical indicators consolidate well below their mid-lines. In the 4 hours chart the 20 SMA has capped the upside earlier in the day and stands now at 1.5385, the Momentum indicator lacks directional strength below the 100 level, but the RSI indicator heads lower near 32, supporting the ongoing bearish tone.
Support levels: 1.5290 1.5250 1.5220
Resistance levels: 1.5360 1.5400 1.5440
USD/JPY Current price: 119.81
View Live Chart for the USD/JPY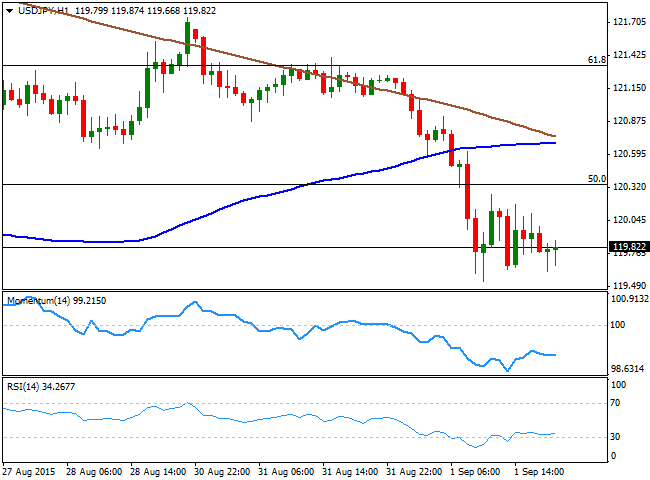
The USD/JPY plummeted to a daily low of 119.53 and remained unable to regain the 120.00 level afterwards, as investors run towards safety on market's generalized turmoil. The safe haven currency advanced against all of its major rivals, and the USD/JPY short term picture favors additional declines, as the price has accelerated south after breaking below its 100 SMA, whilst the RSI indicator holds near oversold territory. Also, the pair is back below the 50% retracement of the last two weeks decline at 120.35, and the bearish potential will remain strong as long as sellers surge around it. In the 4 hours chart, the technical indicators present a strong bearish momentum well into negative territory, supporting further declines on a break below 119.35, the 38.2% retracement of the same rally.
Support levels: 119.35 118.90 118.50
Resistance levels: 120.35 120.60 121.00
AUD/USD Current price: 0.7030
View Live Chart for the AUD/USD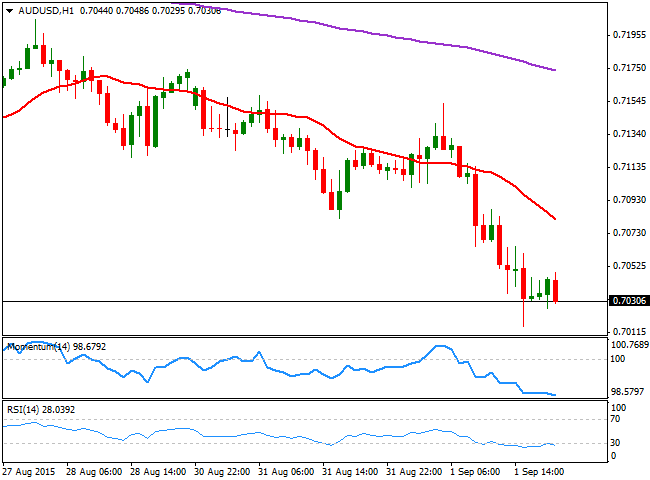
The AUD/USD pair fell down to a fresh 6-year low of 0.7015, and remains a few points above it, with the Aussie being weighed by Chinese turmoil. Earlier in the day, the RBA had its monthly economic policy meeting, where policymakers decided to leave the cash rate unchanged at 2.0%. Governor Stevens said that the Central Bank acknowledged that the "global economy is expanding at a moderate pace, with some further softening in conditions in China and east Asia of late," which reduces chances of an economic recovery in Australia. The less dovish than-expected tone in the speech gave the pair a temporal boost, sending it up to 0.7153, from where it slowly resumed the downside. Technically, the bearish potential is still strong, as in the 1 hour chart, the 20 SMA presents a strong bearish slope well above the current level whilst the technical indicator hover near oversold readings. In the 4 hours chart, the Momentum indicator heads sharply lower below the 100 level whilst the RSI hovers around 31, supporting the shorter term view.
Support levels: 0.7020 0.6985 0.6950
Resistance levels: 0.7070 0.7100 0.7140
Recommended Content
Editors’ Picks
How will US Dollar react to Q1 GDP data? – LIVE

The US' GDP is forecast to grow at an annual rate of 2.5% in the first quarter of the year. The US Dollar struggles to find demand as investors stay on the sidelines, while waiting to assess the impact of the US economic performance on the Fed rate outlook.
EUR/USD holds gains above 1.0700, as key US data loom

EUR/USD holds gains above 1.0700 in the European session on Thursday. Renewed US Dollar weakness offsets the risk-off market environment, supporting the pair ahead of the key US GDP and PCE inflation data.
GBP/USD extends recovery above 1.2500, awaits US GDP data

GBP/USD is catching a fresh bid wave, rising above 1.2500 in European trading on Thursday. The US Dollar resumes its corrective downside, as traders resort to repositioning ahead of the high-impact US advance GDP data for the first quarter.
Gold price edges higher amid weaker USD and softer risk tone, focus remains on US GDP

Gold price (XAU/USD) attracts some dip-buying in the vicinity of the $2,300 mark on Thursday and for now, seems to have snapped a three-day losing streak, though the upside potential seems limited.
XRP extends its decline, crypto experts comment on Ripple stablecoin and benefits for XRP Ledger

Ripple extends decline to $0.52 on Thursday, wipes out weekly gains. Crypto expert asks Ripple CTO how the stablecoin will benefit the XRP Ledger and native token XRP.