EUR/USD Current price: 1.1249
View Live Chart for the EUR/USD
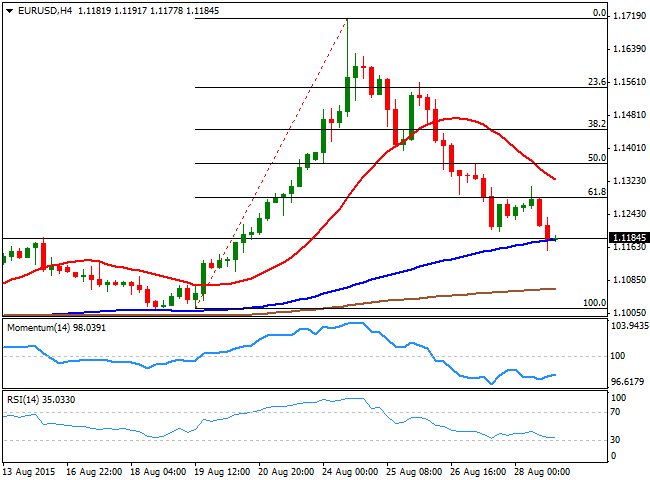
The American dollar extended its gains on Friday, closing the week generally stronger against most of its major rivals. The EUR/USD pair that traded as high as 1.1713, edged down at 1.1184. In the US, the Jackson Hole Economic Symposium that started on Friday showed that most of FED's voting members are still pretty confident in the pace of the economic recovery, resulting overall hawkish and supporting dollar's advance. Being the first week of the month, the economic calendar will be fulfilled with key macroeconomic events, which include economic policy meetings from Central Banks in Australia and Europe, and the US Nonfarm Payroll report, on Friday. The US monthly employment report will be the last before FED's September meeting, the one when the Central Bank may decide to make its first move, which means that much of the market attention will be focused on it.
In the meantime, the EUR/USD pair has fell steadily for the last four days, having also broken below the 61.8% retracement of these last two-weeks advance, at 1.1280. The daily chart shows that the technical indicators maintain strong bearish slopes, coming from oversold territory and pointing to break below their mid-lines, should the price continue falling. In the same chart, the 100 and 200 DMAs converge around 1.1120, also a critical support level, meaning a break below it is required to confirm additional bearish momentum. In the 4 hours chart, the technical indicators are hovering with no directional strength near oversold territory, whilst the 20 SMA maintains a sharp bearish slope well above the current price, supporting the longer term view.
Support levels: 1.1160 1.1120 1.1075
Resistance levels: 1.1200 1.1245 1.1280
EUR/JPY Current Price: 136.06
View Live Chart for the EUR/JPY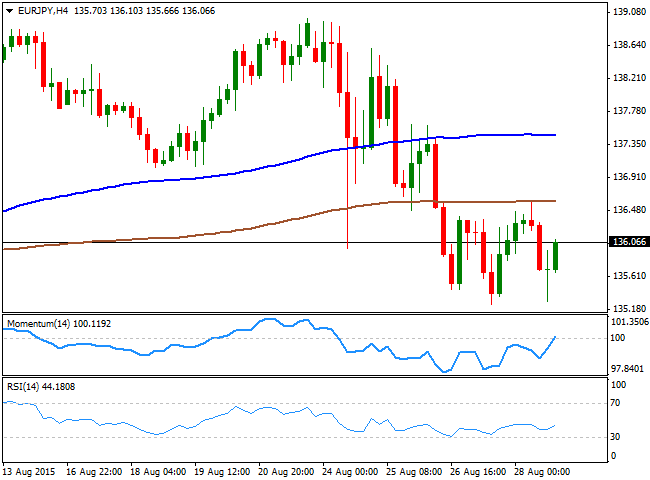
The EUR/JPY pair closed flat on Friday, having maintained a general negative tone on EUR's weakness, an erasing all of its monthly gains. With August about to end, the monthly chart shows a third doji in-a-row, a clear sign that the market is dollar-dependent these days. Daily basis, the pair is biased lower, with the 100 DMA around 136.60 capping the upside and the technical indicators heading south well below their mid-lines. Shorter term, the 4 hours chart suggest the pair may advance some before retreating further, as the RSI indicator aims higher around 44 whilst the Momentum indicator is crossing its mid-line towards the upside. In the same chart however, the price remains well below its moving averages, with the 200 SMA around 136.60, reinforcing the strength of the resistance level. A steady advance beyond it, should signal an upward continuation for this Monday, while an extension below 135.50 should confirm a downward continuation towards fresh lows.
Support levels: 135.90 135.50 134.85
Resistance levels: 136.20 136.65 137.10
GBP/USD Current price: 1.5389
View Live Chart for the GPB/USD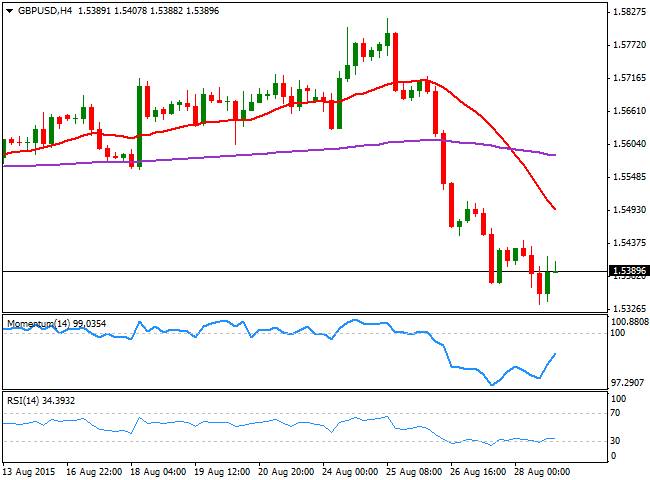
The British Pound was among the most affected from Chinese turmoil and poor local data, ending the week against the greenback around 1.5389, level not seen since early July. The pair surged up to a fresh 2-month high of 1.5817 on the early turmoil triggered by China, only to gave back its gains, hit by fears that the economic slowdown and the lower inflation expectations won't support a rate hike in the first half of 2016. Additionally, on Friday the second estimate of Q2 GDP resulted unchanged at 0.7%, doing little in helping the GBP recover. The GBP/USD pair maintains a bearish tone according to the daily chart, as the technical indicators continue to head lower well below their mid-lines, whilst the 20 SMA has turned south around 1.5600. For this Monday, the 4 hours chart suggest the pair may attempt correcting higher, as the technical indicators are bouncing from oversold levels, although the 20 SMA heads sharply lower above the current level, suggesting a limited upward move. The pair set a low at 1.5334 last week, which means a break below it should signal additional declines towards the strong static support around 1.5250.
Support levels: 1.5370 1.5335 1.5290
Resistance levels: 1.5430 1.5760 1.5710
USD/JPY Current price: 121.70
View Live Chart for the USD/JPY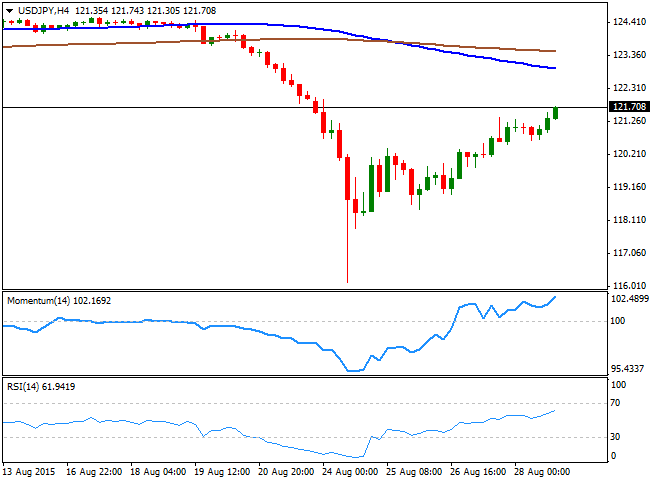
The USD/JPY pair closed last week pretty much unchanged, having erased the early slump of almost 600 pips. The Japanese currency soared on risk aversion, following the slump in global stocks markets, but lost ground alongside with equities recovery. Another reason behind JPY's late decline was poor Japanese inflation figures, with year-on-year National July CPI resulting at 0.2% against previous 0.4%, and Tokyo figure resulting at 0.1% against the 0.2% previous. The deflationary pressures are still high, and BOJ's Governor Kuroda may have to add more stimulus if he actually wants to achieve a 2.0% inflation by the first half of next year. Technically, the daily chart shows that the price has recovered above its 200 DMA, around 121.00, whilst the technical indicators continue correcting higher from extreme oversold levels, but remain well below their mid-lines. In the same chart, the 100 DMA stands at 122.80, becoming a critical longer term resistance. In the 4 hours chart the technical picture is clearly bullish, with the technical indicators heading north, despite being near overbought readings, which means additional recoveries should be expected, particularly if the pair regains the 122.00 figure.
Support levels: 121.40 121.00 120.60
Resistance levels: 122.00 122.40 122.80
AUD/USD Current price: 0.7172
View Live Chart for the AUD/USD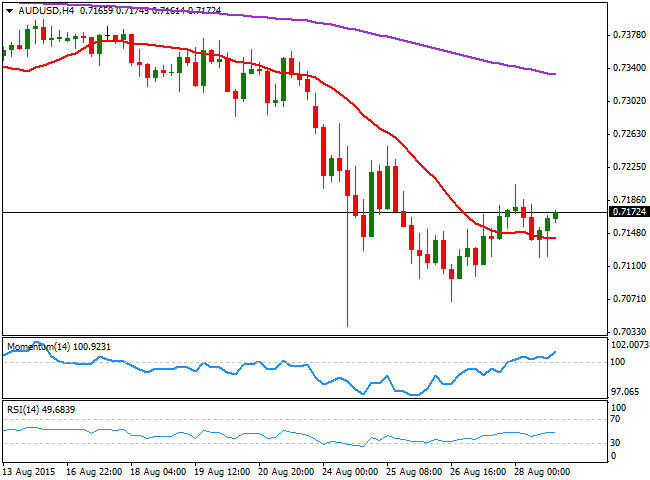
The AUD/USD pair closed in the red for a third week in-a-row, having however, recovered part of the ground lost after establishing a multi-year low of 0.7039. Nevertheless, the latest AUD bullishness was unable to survive Chinese's economic slowdown, and the antipodean currency may suffer additional losses this week. Most of it will depend on how Governor Glenn Stevens addresses the latest developments in the upcoming RBA meeting next Tuesday. In their latest meeting, policy makers were less eager for a weaker currency, saying the AUD decline have done enough to support economic growth, and suggesting the currency may have reached a bottom. If they now express concerns over China and the continued depreciation of their currency, the risk will probably remain towards the downside. Technically, the daily chart shows that the AUD/USD pair may continue declining, as the technical indicators have turned south following a limited correction of oversold readings, whilst the 20 SMA heads strongly lower far above the current price. In the 4 hours chart however, the intraday outlook seems bullish, with the price holding above a flat 20 SMA and the technical indicators heading higher above their mid-lines, supporting an extension towards the 0.7240/50 strong static resistance area.
Support levels: 0.7150 0.7110 0.7070
Resistance levels: 0.7200 0.7245 0.7290
Recommended Content
Editors’ Picks
AUD/USD stands firm above 0.6500 with markets bracing for Aussie PPI, US inflation

The Aussie Dollar begins Friday’s Asian session on the right foot against the Greenback after posting gains of 0.33% on Thursday. The AUD/USD advance was sponsored by a United States report showing the economy is growing below estimates while inflation picked up. The pair traded at 0.6518.
EUR/USD faces a minor resistance near at 1.0750

EUR/USD quickly left behind Wednesday’s small downtick and resumed its uptrend north of 1.0700 the figure, always on the back of the persistent sell-off in the US Dollar ahead of key PCE data on Friday.
Gold soars as US economic woes and inflation fears grip investors

Gold prices advanced modestly during Thursday’s North American session, gaining more than 0.5% following the release of crucial economic data from the United States. GDP figures for the first quarter of 2024 missed estimates, increasing speculation that the US Fed could lower borrowing costs.
Bitcoin price continues to get rejected from $65K resistance as SEC delays decision on spot BTC ETF options

Bitcoin (BTC) price has markets in disarray, provoking a broader market crash as it slumped to the $62,000 range on Thursday. Meanwhile, reverberations from spot BTC exchange-traded funds (ETFs) continue to influence the market.
US economy: Slower growth with stronger inflation

The dollar strengthened, and stocks fell after statistical data from the US. The focus was on the preliminary estimate of GDP for the first quarter. Annualised quarterly growth came in at just 1.6%, down from the 2.5% and 3.4% previously forecast.