EUR/USD Current price: 1.1232
View Live Chart for the EUR/USD

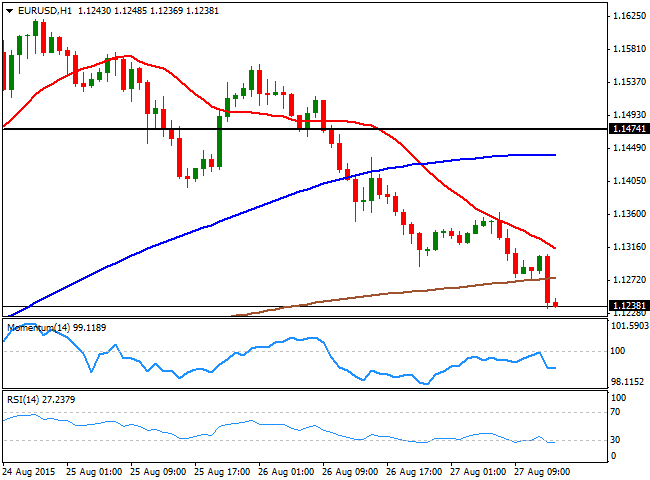
The EUR/USD pair extended its decline and quotes at the lowest of the week after the release of much better-than-expected advanced GDP readings for the second quarter. The US has grown 3.7% according to the preliminary figures, surpassing expectations of 3.2%. Also, weekly unemployment claims for the week ending August 22 printed 271, better than the 274K expected. The EUR/USD 1 hour chart shows that the price holds near the lows, and below its moving averages, whilst the technical indicators remain flat in oversold levels. In the 4 hours chart, the price is well below a bearish 20 SMA, whilst the technical indicators head lower near oversold territory, maintaining the risk towards the downside.
Support levels: 1.1220 1.1185 1.1150
Resistance levels: 1.1260 1.1300 1.1345
GBP/USD Current price: 1.5418
View Live Chart for the GPB/USD
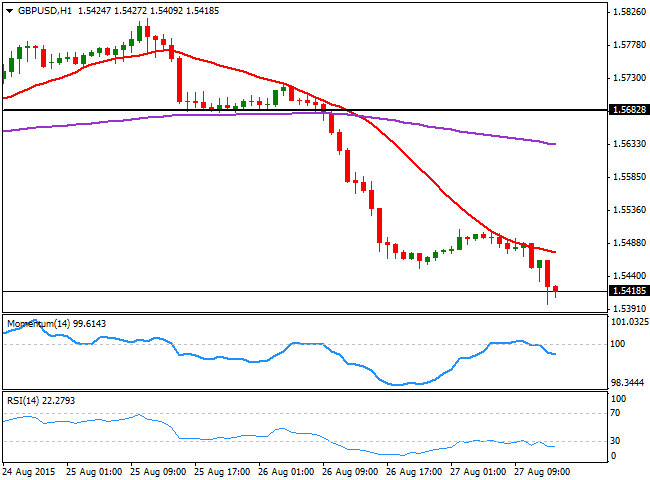
The GBP/USD extended its decline down to 1.5399, maintaining a strong negative tone and with the 1 hour chart showing that the price was unable to advance beyond its 20 SMA, currently offering a strong dynamic resistance around 1.5460, while the RSI indicator heads lower around 20, and the Momentum indicator retreats from its 100 level. In the 4 hours chart the technical readings are in extreme oversold levels, but also maintaining their sharp bearish slopes, supporting additional declines for the upcoming hours.
Support levels: 1.5370 1.5335 1.5290
Resistance levels: 1.5425 1.5460 1.5500
USD/JPY Current price: 120.55
View Live Chart for the USD/JPY
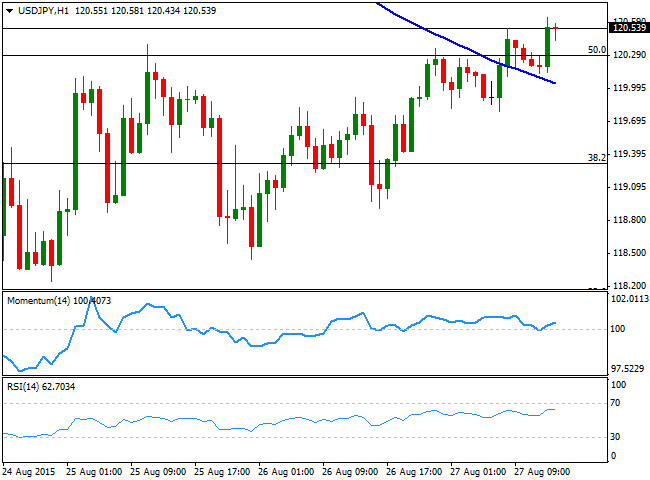
The USD/JPY advanced just a few pips above its former daily high and reached 120.63 with the news, a really shallow advanced taking into account the positive surprise triggered by US GDP data. The 1 hour chart shows that the price is now above its 100 SMA, and above the 50% retracement of these last two weeks decline around 120.30, the immediate support. In the same chart, the technical indicators head higher above their mid-lines, but lack upward momentum. In the 4 hours chart, the upside seems a bit more constructive, with the immediate bullish target at 121.00 the 100 DMA, followed by 121.35, the 61.8% retracement of the same rally.
Support levels: 120.30 119.90 119.60
Resistance levels: 121.00 121.35 121.70
AUD/USD Current price: 0.7131
View Live Chart for the AUD/USD
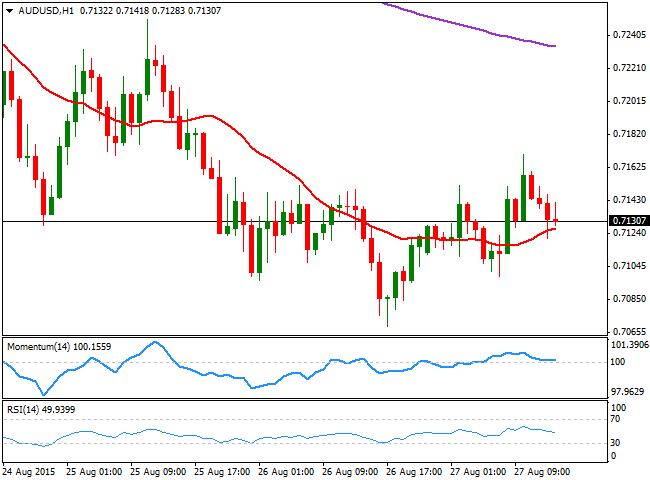
The AUD/USD eases from a daily high of 0.7170, trading a few pips above its daily opening, pretty much flat on the day. The short term technical picture shows that in the 1 hour chart, the price is a couple of pips above a bullish 20 SMA, whilst the technical indicators hover around their mid-lines, lacking clear directional strength. In the 4 hours chart the upside was limited by a still bearish 20 SMA ever since the day started, whilst the RSI indicator resumes its decline near 41, maintaining the risk towards the downside.
Support levels: 0.7110 0.7070 0.7030
Resistance levels: 0.7145 0.7190 0.7240
Recommended Content
Editors’ Picks
EUR/USD consolidates recovery below 1.0700 amid upbeat mood

EUR/USD is consolidating its recovery but remains below 1.0700 in early Europe on Thursday. The US Dollar holds its corrective decline amid a stabilizing market mood, despite looming Middle East geopolitical risks. Speeches from ECB and Fed officials remain on tap.
GBP/USD advances toward 1.2500 on weaker US Dollar

GBP/USD is extending recovery gains toward 1.2500 in the European morning on Thursday. The pair stays supported by a sustained US Dollar weakness alongside the US Treasury bond yields. Risk appetite also underpins the higher-yielding currency pair. ahead of mid-tier US data and Fedspeak.
Gold appears a ‘buy-the-dips’ trade on simmering Israel-Iran tensions

Gold price attempts another run to reclaim $2,400 amid looming geopolitical risks. US Dollar pulls back with Treasury yields despite hawkish Fedspeak, as risk appetite returns. Gold confirmed a symmetrical triangle breakdown on 4H but defends 50-SMA support.
Manta Network price braces for volatility as $44 million worth of MANTA is due to flood markets

Manta Network price was not spared from the broader market crash instigated by a weakness in the Bitcoin market. While analysts call a bottoming out in the BTC price, the Web3 modular ecosystem token could suffer further impact.
Investors hunkering down

Amidst a relentless cautionary deluge of commentary from global financial leaders gathered at the International Monetary Fund and World Bank Spring meetings in Washington, investors appear to be taking a hiatus after witnessing significant market movements in recent weeks.