EUR/USD Current price: 1.0977
View Live Chart for the EUR/USD

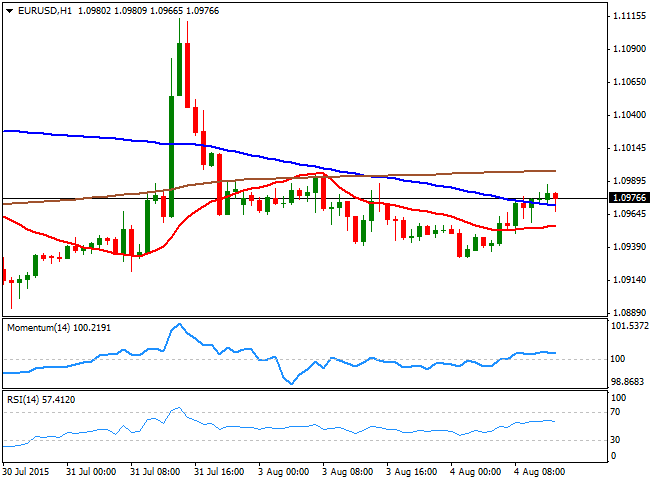
The dollar trades generally lower across the board, with the EUR/USD pair reaching so far a daily high of 1.0987, sill attracting selling interest on approaches to the 1.1000 figure. Earlier in the day, the EU Producer Price Index showed that inflation fell -0.1% in July, representing an annual drop of 2.2%. The pair however, was little affected by the news, and holds near its daily high ahead of the US opening. The technical picture is for the most neutral, albeit the 1 hour chart favors another leg higher, being that the price has extended above its 20 SMA whilst the technical indicators hold above their mid-lines. In the 4 hours chart, the price is barely extending above a directionless 20 SMA, whilst the technical indicators also lack directional strength around their mid-lines. At this point, only a clear recovery beyond 1.1000 should favor additional advances, whilst below 1.0920 the pair may begin to ease down to the 1.0850 region.
Support levels: 1.0920 1.0890 1.0850
Resistance levels: 1.1000 1.1050 1.1080
GBP/USD Current price: 1.5614
View Live Chart for the GPB/USD
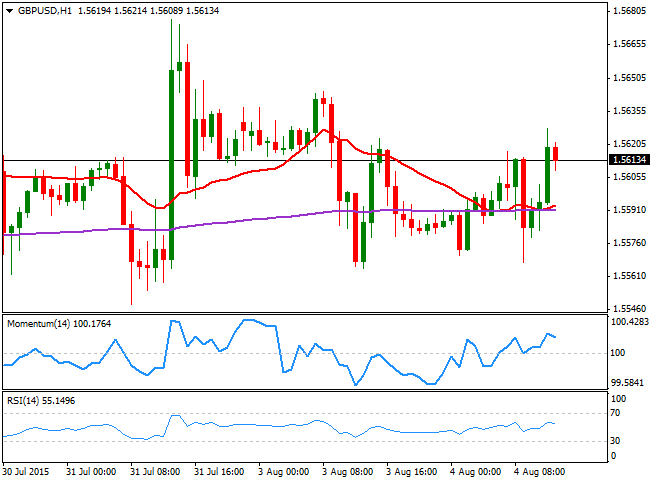
The GBP/USD pair continues trading in a limited range around the 1.5600 level, having once again recovered after testing the 1.5560 region earlier in the day. In the UK, the Markit construction PMI fell in July to 57.1 after hitting a four-month high of 58.1 in June, keeping the upside limited despite dollar's weak tone. Technically, the 1 hour chart shows that the 20 SMA stands flat below the current level, whilst the technical indicator head nowhere above their mid-lines. In the 4 hours chart, the price has bounced from a horizontal 200 EMA, with the price now extending above its 20 SMA and the technical indicators heading higher above their mid-lines, supporting additional gains on an advance above 1.5635 the immediate resistance.
Support levels: 1.5560 1.5520 1.5475
Resistance levels: 1.5635 1.5670 1.5710
USD/JPY Current price: 123.93
View Live Chart for the USD/JPY
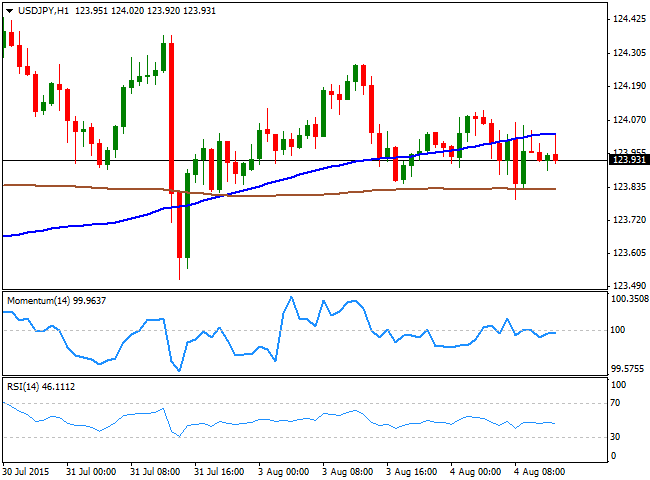
Still waiting for a trigger. The USD/JPY pair remains within a restricted intraday range below the 124.00 level, with short lived spikes above the figure being quickly rejected. The 1 hour chart shows that the price continues hovering between its 100 and 200 SMAs, albeit the technical indicators present a mild negative tone suggesting the pair may extend its decline in the short term, particularly on a break below 123.70 the immediate support, in route to the 123.30 level. In the 4 hours chart the price is holding above its 100 SMA, but the technical indicators are also heading south below their mid-lines, supporting the shorter term view. Advances up to 124.45 should be seen as short term selling opportunities, as only a clear break above the level will support the upside.
Support levels: 123.70 123.30 122.90
Resistance levels: 124.45 124.90 125.30
AUD/USD Current price: 0.7395
View Live Chart for the AUD/USD
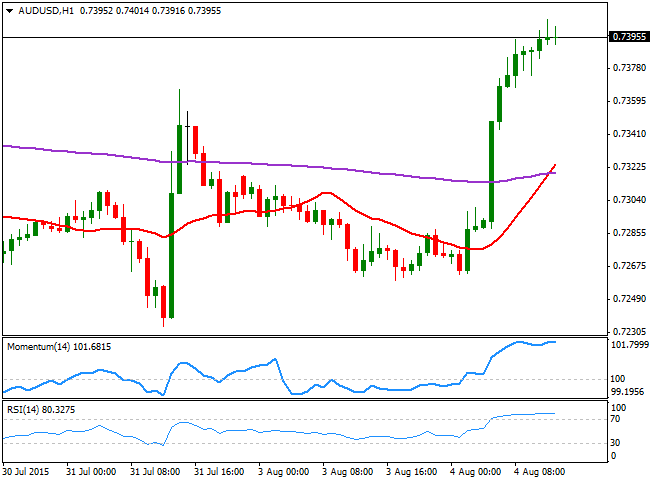
The Aussie got a boost from the RBA during the Asian session, as the Central Bank decided to keep its rates on hold. The AUD/USD pair soared over 100 pips with the news, and maintains the bullish tone, extending to fresh highs around 0.7400 in the European opening. The 1 hour chart shows that, despite being in overbought levels, the technical indicators continue heading higher, whilst the 20 SMA also presents a sharp bullish slope well below the current price. In the 4 hours chart, the technical picture is quite alike, with the Momentum indicator heading north in overbought levels, but the RSI indicator already losing its upward strength. Nevertheless, higher highs suggest the corrective movement can extend up to 0.7450 during the upcoming hours, where investors may likely decide to take some profits out before deciding next move.
Support levels: 0.7370 0.7340 0.7300
Resistance levels: 0.7410 0.7450 0.7490
Recommended Content
Editors’ Picks
AUD/USD failed just ahead of the 200-day SMA

Finally, AUD/USD managed to break above the 0.6500 barrier on Wednesday, extending the weekly recovery, although its advance faltered just ahead of the 0.6530 region, where the key 200-day SMA sits.
EUR/USD met some decent resistance above 1.0700

EUR/USD remained unable to gather extra upside traction and surpass the 1.0700 hurdle in a convincing fashion on Wednesday, instead giving away part of the weekly gains against the backdrop of a decent bounce in the Dollar.
Gold keeps consolidating ahead of US first-tier figures

Gold finds it difficult to stage a rebound midweek following Monday's sharp decline but manages to hold above $2,300. The benchmark 10-year US Treasury bond yield stays in the green above 4.6% after US data, not allowing the pair to turn north.
Bitcoin price could be primed for correction as bearish activity grows near $66K area

Bitcoin (BTC) price managed to maintain a northbound trajectory after the April 20 halving, despite bold assertions by analysts that the event would be a “sell the news” situation. However, after four days of strength, the tables could be turning as a dark cloud now hovers above BTC price.
Dow Jones Industrial Average hesitates on Wednesday as markets wait for key US data

The DJIA stumbled on Wednesday, falling from recent highs near 38,550.00 as investors ease off of Tuesday’s risk appetite. The index recovered as US data continues to vex financial markets that remain overwhelmingly focused on rate cuts from the US Fed.