EUR/USD Current price: 1.0948
View Live Chart for the EUR/USD

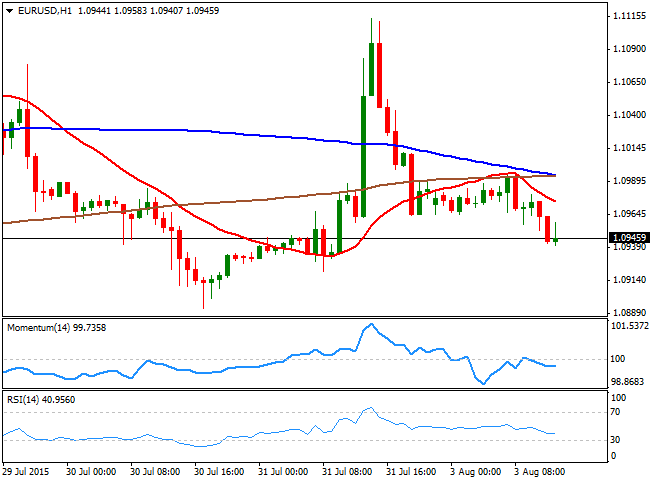
The dollar posted limited advances in the European opening, mostly helped by a slump in commodities, triggered by Chinese Manufacturing PMI, printing a 2-year low of 47.8 in July. In Europe, the release of the local PMI figures showed that manufacturing in the region ticked higher, despite Greek manufacturing PMI resulted at 30.2 in July. The greenback resumed its advance as the session went through, albeit posting limited gains until the release of the US PCE figures. The data showed that personal income climbed 0.4% against 0.3% estimated, whilst spending resulted at 0.2% as expected. The PCE price index ticked higher compared to a year before, resulting at 1.3% whilst monthly basis came out at 0.3%, also slightly above the previous one. It's still pending the release of the US Markit Manufacturing PMI, Construction spending, and a speech from FOMC's Powell. In the meantime, the EUR/USD short term picture is bearish, as the 1 hour chart shows that the price remains near its daily low and below its moving averages, whilst the technical indicators stand below their mid-lines, albeit lacking directional strength. In the 4 hours chart, the technical indicators turned south around their mid-lines, whilst the 20 SMA maintains a strong bearish slope above the current level, supporting additional declines.
Support levels: 1.0920 1.0890 1.0850
Resistance levels: 1.1000 1.1050 1.1080
GBP/USD Current price: 1.5578
View Live Chart for the GPB/USD
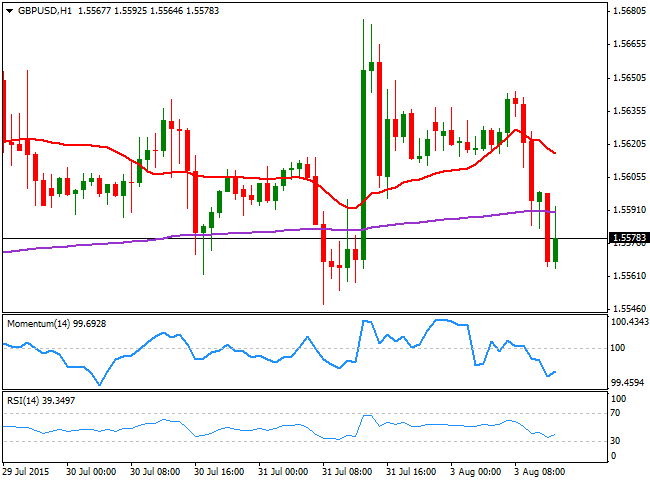
The GBP/USD pair triggered some short term stops below the 1.5600 level, and fell down to 1.5565, finding some limited intraday demand around its 4 hours 200 EMA. Earlier in the day, the UK also released its PMI figures, which resulted slightly above expected in July, at 51.9 posting the smallest advance in over a year. Technically, the 1 hour chart shows that the price develops below a bearish 20 SMA, although the technical indicators aim higher in negative territory. In the 4 hours chart however, the risk remains towards the downside as the technical indicators have extended below their mid-lines, whilst the 20 SMA gains bearish slope above the current price. Should the price extend below its 200 EMA, the next bearish target comes at 1.5520, with a break below this last probably fueling the decline towards the 1.5470/80 region.
Support levels: 1.5560 1.5520 1.5475
Resistance levels: 1.5600 1.5635 1.5670
USD/JPY Current price: 124.24
View Live Chart for the USD/JPY
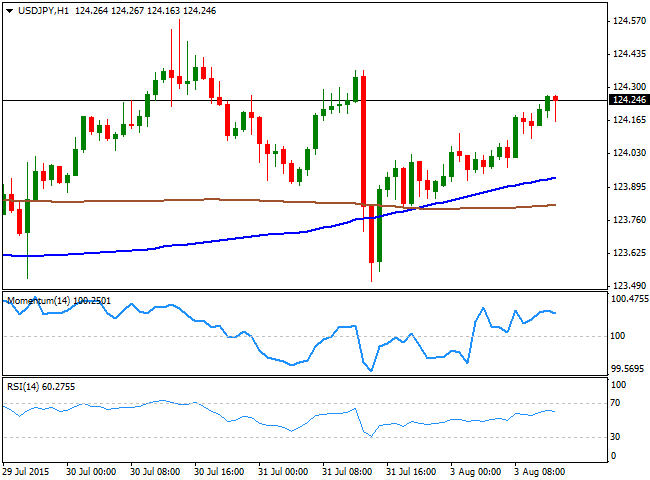
Going nowhere above 124.00. The USD/JPY pair surged above the 124.00 level this Monday, as dollar strengthen against most of its major rivals, even before the release of better-than-expected US PCE inflation figures. The data however, failed to boost the greenback that anyway maintains a positive tone across the board. Technically the 1 hour chart shows that the price has extended further above a bullish 100 SMA that crossed above the 200 SMA, with the shortest capping the downside around 124.00. In the same chart the technical indicators are turning lower near overbought levels, but remain far from suggesting a downward corrective movement underway. In the 4 hours chart, the Momentum indicators diverges from price action, heading lower around its mid-line while the RSI indicator consolidates around 58. A steadier advance above 124.45, the immediate resistance, is required to confirm a stronger advance, but chances are limited at the time being, whilst the downside seems also limited by buying interest around 123.70/124.00.
Support levels: 124.00 123.70 123.30
Resistance levels: 124.45 124.90 125.30
AUD/USD Current price: 0.7265
View Live Chart for the AUD/USD
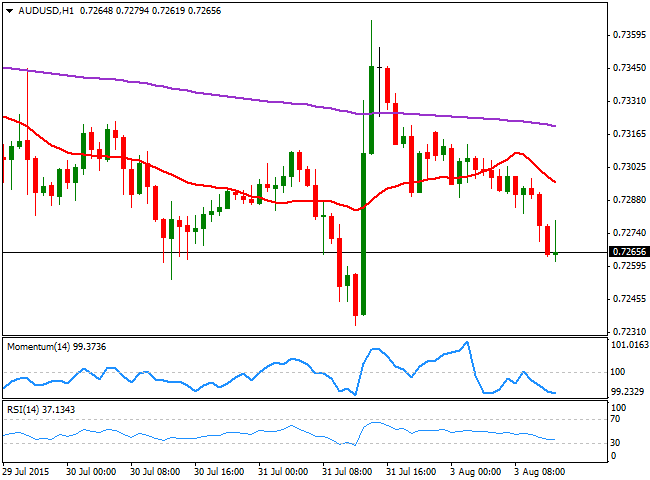
The AUD/USD broke below the 0.7300 level during the past Asian session, with the Aussie weighed by poor Chinese manufacturing data and falling metals, albeit movements across the board have been quite limited so far in the day. Nevertheless, the bearish bias is clear intraday, as the 1 hour chart shows that the price is well below a strongly bearish 20 SMA, whilst the technical indicators head south below their mid-lines. In the 4 hours chart, the price is also below a bearish 20 SMA while the technical indicators head slightly lower below their mid-lines, supporting a decline towards fresh lows.
Support levels: 0.7250 0.7220 0.7190
Resistance levels: 0.7300 0.7340 0.7375
Recommended Content
Editors’ Picks
EUR/USD fluctuates near 1.0700 after US data

EUR/USD stays in a consolidation phase at around 1.0700 in the American session on Wednesday. The data from the US showed a strong increase in Durable Goods Orders, supporting the USD and making it difficult for the pair to gain traction.
USD/JPY refreshes 34-year high, attacks 155.00 as intervention risks loom

USD/JPY is renewing a multi-decade high, closing in on 155.00. Traders turn cautious on heightened risks of Japan's FX intervention. Broad US Dollar rebound aids the upside in the major. US Durable Goods data are next on tap.
Gold stays in consolidation above $2,300

Gold finds it difficult to stage a rebound midweek following Monday's sharp decline but manages to hold above $2,300. The benchmark 10-year US Treasury bond yield stays in the green above 4.6% after US data, not allowing the pair to turn north.
Worldcoin looks set for comeback despite Nvidia’s 22% crash Premium

Worldcoin price is in a better position than last week's and shows signs of a potential comeback. This development occurs amid the sharp decline in the valuation of the popular GPU manufacturer Nvidia.
Three fundamentals for the week: US GDP, BoJ and the Fed's favorite inflation gauge stand out Premium

While it is hard to predict when geopolitical news erupts, the level of tension is lower – allowing for key data to have its say. This week's US figures are set to shape the Federal Reserve's decision next week – and the Bank of Japan may struggle to halt the Yen's deterioration.