EUR/USD Current price: 1.1028
View Live Chart for the EUR/USD

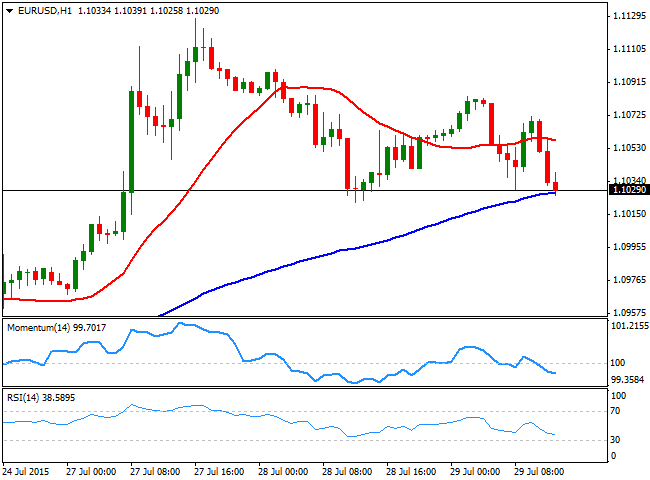
The dollar is gathering some limited intraday momentum against most of its rivals, in a pretty quiet European morning. To the lack of fundamental releases in the region, the upcoming FED decision is adding uncertainty on what's next for the American currency, or better said, "when" this next will come. The US Central Bank has largely anticipated it will begin rising rates as soon as this year, albeit from early speculations the tightening would began in April, there days doubts are whether it will start in September, which may then signal 2 rate hikes this year, or in December. Given that there will be no forecast, neither a press conference following the decision, investors will be watching the wording of the statement, with an overall sense that the tone will flip to hawkish. Ahead of the US opening, the EUR/USD pair is under selling pressure, with the hourly chart showing that the price pressures its 100 SMA and the technical indicators head lower well below their mid-lines. In the 4 hours chart, the price is breaking below its 20 SMA, whilst the technical indicators are positioned to cross their mid-lines towards the downside, anticipating additional declines on a break below 1.1020, the immediate short term support.
Support levels: 1.1020 1.0990 1.0950
Resistance levels: 1.1080 1.1125 1.1160
GBP/USD Current price: 1.5640
View Live Chart for the GPB/USD
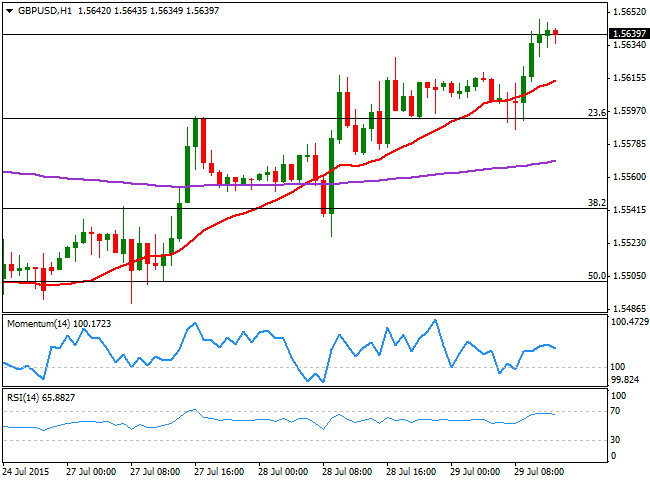
The GBP/USD pair trades at fresh weekly highs having reached 1.5648 after the release of positive UK mortgage approvals data that rose above expected in June. The short term picture is bullish, with the price accelerating above a bullish 20 SMA, and the technical indicators losing partially its bullish strength near overbought levels. In the 4 hours chart the upside looks more constructive after the 20 SMA advanced above the 200 EMA below the current price albeit the technical indicators also lack upward momentum, despite being well into positive territory. The pair has been rejected from the 1.5670 region several times during this July, which means it needs to advance beyond it to confirm a more sustainable recovery during the upcoming sessions.
Support levels: 1.5590 1.5545 1.5500
Resistance levels: 1.5670 1.5730 1.5770
USD/JPY Current price: 123.69
View Live Chart for the USD/JPY
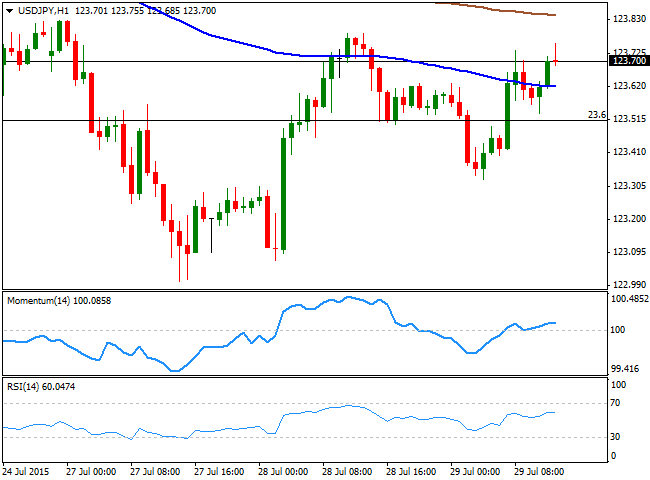
It´s all about the FED for the USD/JPY. The USD/JPY pair maintains its neutral stance ahead of the US opening, waiting for the FOMC. Before it, the US will release the Pending Home Sales for June, which may have a limited effect in the market. However, the housing sector has been among the worst performers this month, and another tepid reading may put the greenback under pressure. As for the USD/JPY, the pair continues trading in a well-defined range, with a mild positive short term tone as the 1 hour chart shows that the technical indicators hold above their mid-lines, whilst the price stands now above its 100 SMA. In the 4 hours chart, the price held above its moving averages on an early dip, whilst the technical indicators head north in positive territory. Nevertheless, it's about the FED today, with scope to advance up to 124.45 should the US Central Bank delivers a hawkish statement.
Support levels: 123.30 122.90 122.40
Resistance levels: 124.20 124.45 124.90
AUD/USD Current price: 0.7311
View Live Chart for the AUD/USD
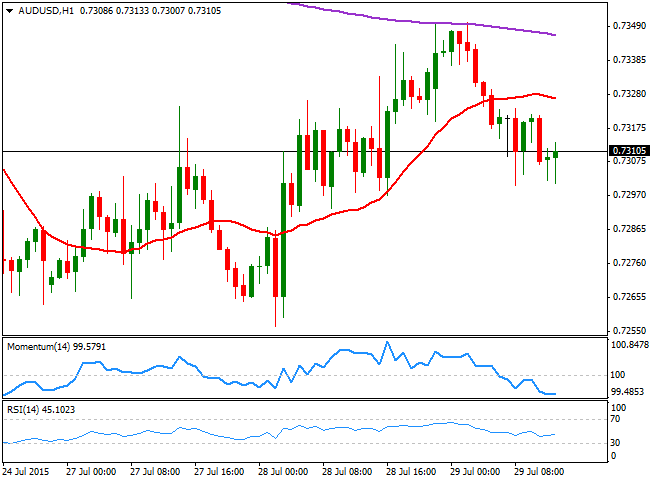
The Australian dollar faded its latest gains, but trades a handful of pips above the 0.7300 level against the greenback, maintaining a bearish short term tone. There was no data released during the Asian session, and the pair failed to advance despite Chinese stocks recovered over 3.0%, bringing some relied to the region. The pair is technically bearish, with the 1 hour chart showing that the price develops below its 20 SMA whilst the technical indicators stand below their mid-lines, lacking directional strength at the time being. In the 4 hours chart, however, the downside seems limited at the time being, with the price finding intraday support in a horizontal 20 SMA, and the technical indicators bouncing from their mid-lines.
Support levels: 0.7300 0.7260 0.7225
Resistance levels: 0.7350 0.7390 0.7440
Recommended Content
Editors’ Picks
EUR/USD clings to daily gains above 1.0650

EUR/USD gained traction and turned positive on the day above 1.0650. The improvement seen in risk mood following the earlier flight to safety weighs on the US Dollar ahead of the weekend and helps the pair push higher.
GBP/USD recovers toward 1.2450 after UK Retail Sales data

GBP/USD reversed its direction and advanced to the 1.2450 area after touching a fresh multi-month low below 1.2400 in the Asian session. The positive shift seen in risk mood on easing fears over a deepening Iran-Israel conflict supports the pair.
Gold holds steady at around $2,380 following earlier spike

Gold stabilized near $2,380 after spiking above $2,400 with the immediate reaction to reports of Israel striking Iran. Meanwhile, the pullback seen in the US Treasury bond yields helps XAU/USD hold its ground.
Bitcoin Weekly Forecast: BTC post-halving rally could be partially priced in Premium

Bitcoin price shows no signs of directional bias while it holds above $60,000. The fourth BTC halving is partially priced in, according to Deutsche Bank’s research.
Week ahead – US GDP and BoJ decision on top of next week’s agenda

US GDP, core PCE and PMIs the next tests for the Dollar. Investors await BoJ for guidance about next rate hike. EU and UK PMIs, as well as Australian CPIs also on tap.