EUR/USD Current price: 1.1052
View Live Chart for the EUR/USD
The American dollar stands victorious across the forex board, in another long day of tugs of war between Greece and its creditors. After the country finally defaulted and last-minute negotiations failed, news on Wednesday showed that Tsipras sent a letter to its European counterparts, accepting the latest proposal, but with some conditions. But later on in the day, he asked on national television for a "NO" vote in the weekend referendum, forcing Dijsselbloem to announce an end of negotiations until after the referendum. Also, a surprisingly positive ADP survey in the US boosted the greenback, as the private sector created 237,000 new jobs in June, whilst the US Markit manufacturing PMI rose up to 53.5, and the ISM one resulted at 53.5, both beating expectations.
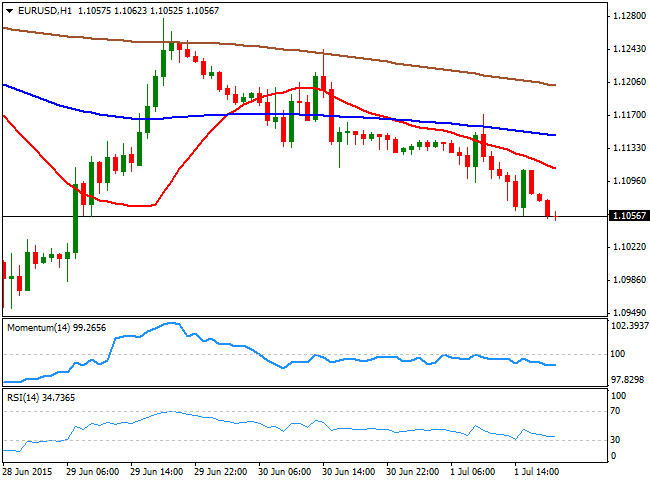
The EUR/USD pair fell down to the 1.1050 region where it stood by the end of the day, with the technical picture favoring the downside ahead of the US monthly employment report to be released on Thursday. The pair spiked up to 1.1170 early Europe, but quickly retreated from the level, unable to establish above the 100 SMA. The 1 hour chart shows that the price extended below its moving averages, whilst the technical indicators maintain a negative tone below their mid-lines. In the 4 hours chart, the bearish momentum is even strength, with the indicators maintaining sharp bearish slopes after crossing their mid-lines towards the downside.
Support levels: 1.1050 1.1010 1.0960
Resistance levels: 1.1080 1.1120 1.1160
EUR/JPY Current price: 136.14
View Live Chart for the EUR/JPY
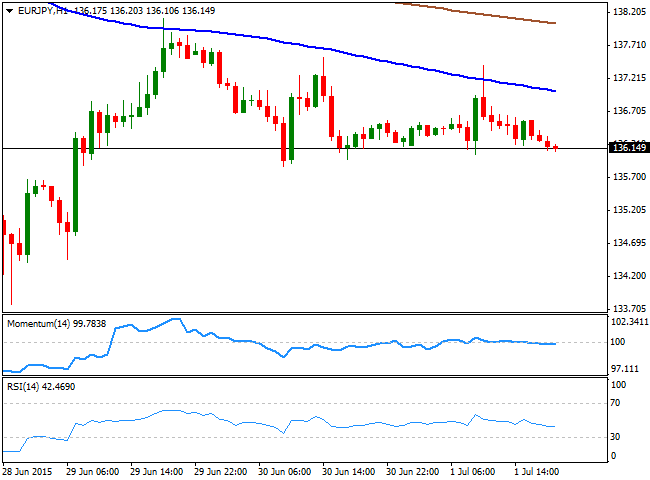
The EUR/JPY remained under pressure, despite the Japanese Yen traded generally lower across the board, amid the EUR being in sell-mode. The pair fell down to 136.05 intraday, and holds a few pips above it by the US close, with the 1 hour chart showing that the price was unable to advance beyond a bearish 100 SMA that continues to attract selling interest. In the same chart, the Momentum indicator presents a tepid bearish tone in neutral territory, whilst the RSI indicator has a more constructive tone, heading south around 42. In the 4 hours chart the upside was contained for a second day in-a-row by the 200 SMA, whilst the technical indicators head sharply lower, supporting the shorter term view, with additional declines needing a break below the 135.80 support to be confirmed.
Support levels: 135.80 135.35 134.90
Resistance levels: 136.40 136.90 137.50
GBP/USD Current price: 1.5594
View Live Chart for the GBP/USD
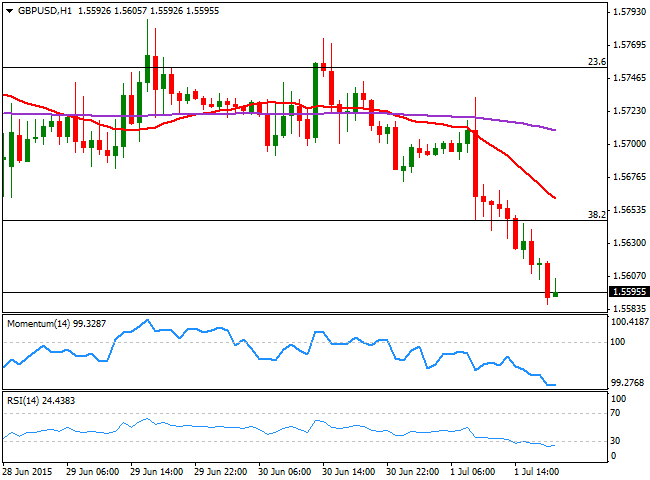
The British Pound finally broke its range against the greenback, and the GBP/USD pair fell down to a fresh 2-week low of 1.5587. The catalyst for the decline was the UK Markit Manufacturing PMI showing that the manufacturing sector fell to 51.4 in June, the weakest reading since April 2013, mostly because of limited export demand from Europe. The news sent the pair down to 1.5645, the 38.2% retracement of the latest bullish run, finally breaking below it after the strong US ADP report. The pair seems poised to extend its decline, trading a few pips above the mentioned low by the end of the day and with the 1 hour chart showing that the technical indicator hold in extreme oversold levels, whilst the 20 SMA turned south well above the current price. In the 4 hours chart the technical indicators have finally left neutral territory, and maintain their strong bearish slopes well into negative territory, favoring a test of 1.5550, the 50% retracement of the same rally and the 200 EMA in this last time frame.
Support levels: 1.5550 1.5520 1.5170
Resistance levels: 1.5610 1.5645 1.5695
USD/JPY Current price: 123.15
View Live Chart for the USD/JPY
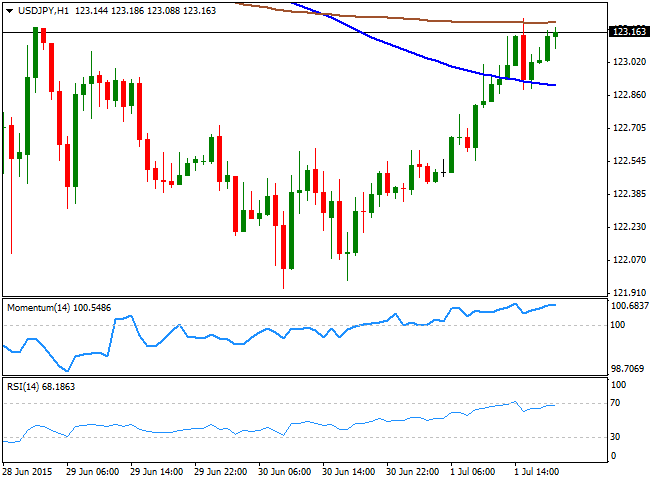
The USD/JPY surged above the 123.00 early in the European session, following BOJ's Governor Kuroda statement that achieving the inflation target could take longer than initially estimated. During the past Asian session, the Central Bank released its quarterly Tankan report that revealed a turn higher in business confidence with the large manufacturers’ diffusion index jumping from 12 in April to 15, the highest level since April 2014, but the report hardly affected the local currency that remained under pressure for the rest of the day. Technically, the 1 hour chart shows that the price recovered above its 20 SMA, now providing an immediate intraday support around 122.85, but stalled around 123.30, the 20 SMA. In the same chart, the technical indicators are losing their upward strength near overbought levels, but remain far from suggesting a downward move. In the 4 hours chart, the technical indicators continue to head higher above their mid-lines, but the price is struggling to overcome its 100 and 200 SMAs, both in a 10 pips range right above the current price.
Support levels: 122.85 122.45 122.00
Resistance levels: 123.30 123.75 124.10
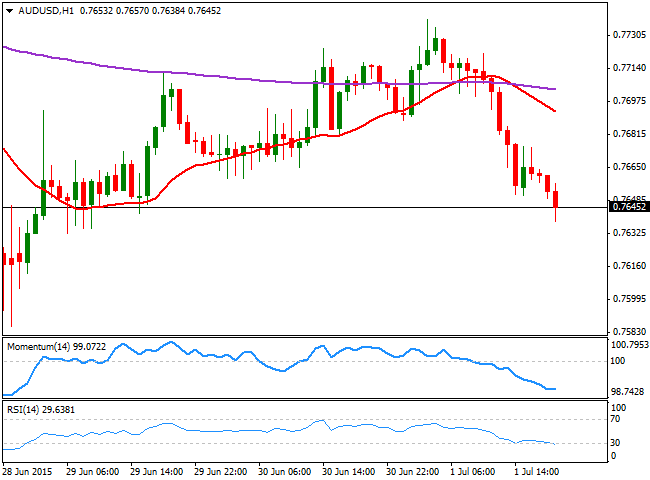
AUD/USD Current price: 0.7645
View Live Chart for the AUD/USD
The Australian dollar extended its decline after reaching a daily high of 0.7738 against the greenback, weighed by a weaker-than-expected Chinese manufacturing PMI, down to 50.2 in June. Also, RBA governor Stevens said in a central banking conference in London that further AUD depreciation is "both likely and necessary" weighting on the currency. The 1 hour chart shows that the 20 SMA turned sharply lower above the current price whilst the RSI indicator continues heading lower around 29, and the Momentum indicator holds in oversold territory, supporting additional declines. In the 4 hours chart, the latest candle extended below a bearish 20 SMA that caps the upside now around 0.7670, whilst the technical indicators have crossed their mid-lines towards the downside and maintain their bearish slopes, supporting the shorter term view, pointing for a break below the 0.7600 figure and to an approach to the lows in the 0.7530 later on in the day.
Support levels: 0.7640 0.7590 0.7550
Resistance levels: 0.7670 0.7720 0.7750
Recommended Content
Editors’ Picks
AUD/USD hovers around 0.6500 amid light trading, ahead of US GDP

AUD/USD is trading close to 0.6500 in Asian trading on Thursday, lacking a clear directional impetus amid an Anzac Day holiday in Australia. Meanwhile, traders stay cautious due ti risk-aversion and ahead of the key US Q1 GDP release.
USD/JPY finds its highest bids since 1990, near 155.50

USD/JPY keeps breaking into its highest chart territory since June of 1990 early Thursday, testing 155.50 for the first time in 34 years as the Japanese Yen remains vulnerable, despite looming Japanese intervention risks. Focus shifts to Thursday's US GDP report and the BoJ decision on Friday.
Gold price lacks firm intraday direction, holds steady above $2,300 ahead of US data

Gold price remains confined in a narrow band for the second straight day on Thursday. Reduced Fed rate cut bets and a positive risk tone cap the upside for the commodity. Traders now await key US macro data before positioning for the near-term trajectory.
Injective price weakness persists despite over 5.9 million INJ tokens burned

Injective price is trading with a bearish bias, stuck in the lower section of the market range. The bearish outlook abounds despite the network's deflationary efforts to pump the price. Coupled with broader market gloom, INJ token’s doomed days may not be over yet.
Meta Platforms Earnings: META sinks 10% on lower Q2 revenue guidance Premium

This must be "opposites" week. While Doppelganger Tesla rode horrible misses on Tuesday to a double-digit rally, Meta Platforms produced impressive beats above Wall Street consensus after the close on Wednesday, only to watch the share price collapse by nearly 10%.
