EUR/USD Current price: 1.1205
View Live Chart for the EUR/USD
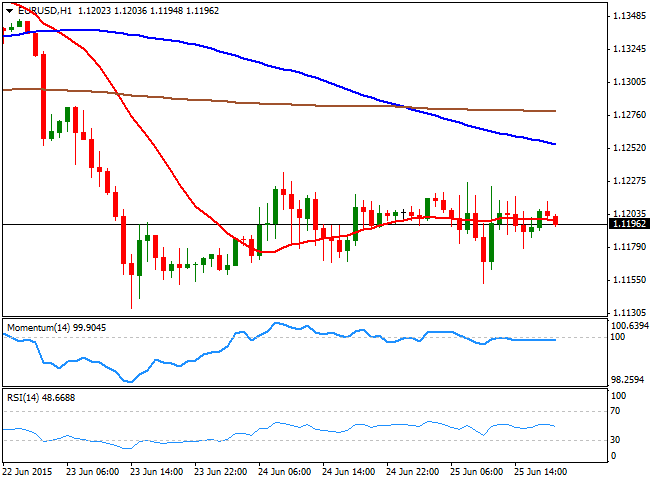
Investors decided to set aside the common currency this Thursday, as the Greek drama continued to new levels, if such thing is even possible. The meeting between the troubled country and its creditors finished with nothing new, except a new meeting scheduled for next Saturday. It's clear that Greece doesn't want to leave the region, and the rest of the Union is far from forcing it out, but somehow they can't agree on the how to keep the EU in one piece. In the meantime, the US released its weekly unemployment claims, slightly better-than-expected for the week ending June 19, at 271K. Also, the country released its personal income and expenditure figures, showing that the core PCE price index, the FED'S favorite measure of inflation, came out at 1.2% as expected yearly basis in May. Finally, the US service sector activity grew less than expected in June, resulting at 54.8.
The EUR/USD pair remained stuck around the 1.1200 level, having traded between a low of 1.1153, and a high of 1.1226. The most likely scenario is that the pair will remain range bound this Friday, although market may trade on risk sentiment, inclining the balance towards the greenback. Technically, the short term outlook is neutral, as the 1 hour chart shows that the price swings around a flat 20 SMA, whilst the technical indicators are attached to their mid-lines, lacking directional strength. In the 4 hours chart, the 20 SMA maintains a strong bearish slope around the mentioned daily high, whilst the technical indicators aim slightly higher in negative territory, far from indicating upward strength.
Support levels: 1.1160 1.1120 1.1050
Resistance levels: 1.1245 1.1280 1.1320
EUR/JPY Current price: 138.35
View Live Chart for the EUR/JPY
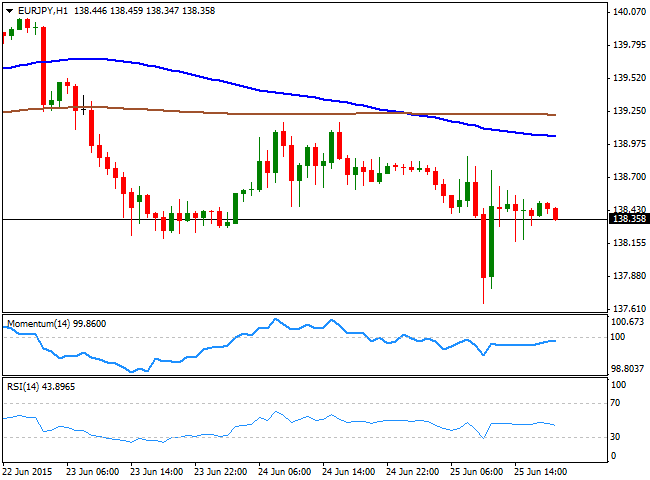
The EUR/JPY has resumed its decline, having fell down to 137.58 before recovering above the 138.00 figure, but the Japanese Yen is poised to continue advancing, as the risk aversion environment will likely keep it buoyed this Friday. The short term picture looks now more downside-constructive, as the 100 SMA has crossed below the 200 SMA above the current price, whilst the technical indicators are turning slightly lower below their mid-lines. In the 4 hours chart, the price continues to be trapped between the 100 SMA, and the 200 SMA, this last providing support around 137.30. In this last chart, the RSI indicator heads strongly lower around 38 whilst the Momentum indicator aims slightly higher below the 100 level. Renewed selling interest below the 137.90 level should lead to additional declines, down towards the 137.30/40 region in the short term.
Support levels: 138.40 137.90 137.45
Resistance levels: 139.10 139.65 140.10
GBP/USD Current price: 1.5738
View Live Chart for the GBP/USD
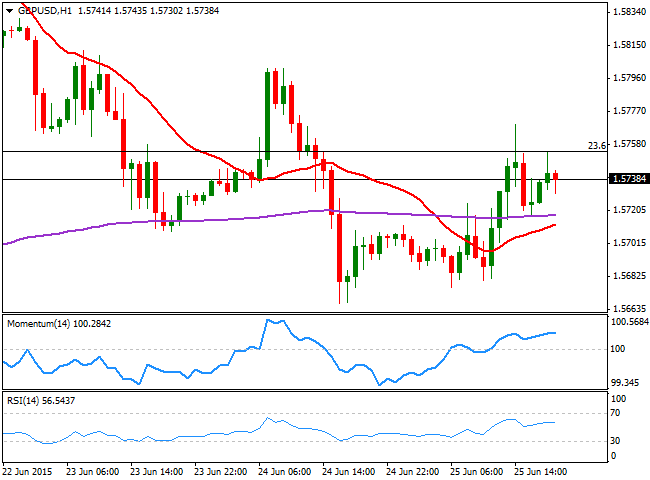
The GBP/USD pair has managed to close in the green, with the Pound recovering the ground lost on Wednesday, although the pair was unable to establish itself above a critical Fibonacci resistance around 1.5750, the 23.6% retracement of its latest bullish run. Despite Greece is overshadowing any other subject in the EU ongoing summit, the UK Prime Minister David Cameron will address the EU leaders in a working dinner, about his planned reforms, or amendments to the EU terms, something that may arise fears of a ´Brexit.´ Nevertheless, this scenario has been so far positive for the Pound, putting the UK further away from the Greek drama. The 1 hour chart shows that the price has been consolidating above a mild bullish 20 SMA whilst the technical indicators are losing upward strength above their mid-lines. In the 4 hours chart, the 20 SMA maintains a strong bearish slope, capping the upside around the mentioned Fibonacci resistance, whilst the technical indicators head higher below their mid-lines, keeping the upside limited at the time being.
Support levels: 1.5700 1.5650 1.5620
Resistance levels: 1.5750 1.5795 1.5840
USD/JPY Current price: 123.58
View Live Chart for the USD/JPY
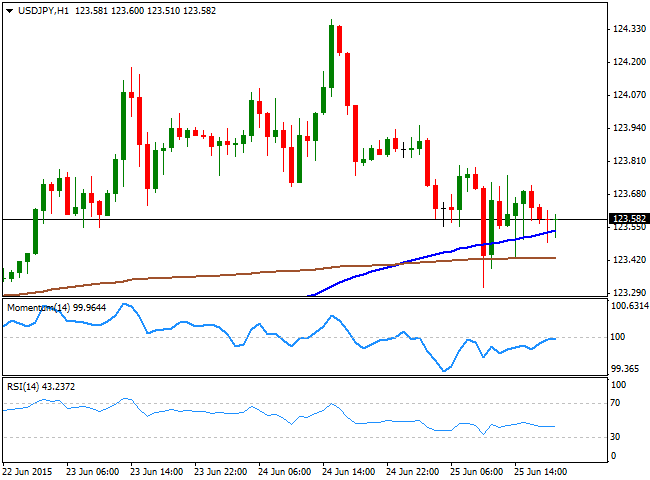
The USD/JPY pair fell down to 123.31 intraday, closing the day in negative territory, despite a short-lived spike triggered by US data. The Japanese Yen is being supported by falling equities and market's uncertainty that pushes investors towards safe-havens. Early Asia, Japan will release its latest inflation figures, expected below previous ones. The short term technical picture however, shows a limited bearish potential, as in the 1 hour chart, the price holds above its 100 and 200 SMAs, with the largest below the shortest and around 123.35, whilst the technical indicator stand below their mid-lines, but lack directional strength. In the 4 hours chart, the technical indicators are heading lower into negative territory with limited bearish slopes, but maintaining the risk towards the downside, with a break below 123.30, the immediate support, favoring a decline towards 122.45, the base of these last weeks' range.
Support levels: 123.30 122.90 122.45
Resistance levels: 124.10 124.45 124.90
AUD/USD Current price: 0.7740
View Live Chart for the AUD/USD
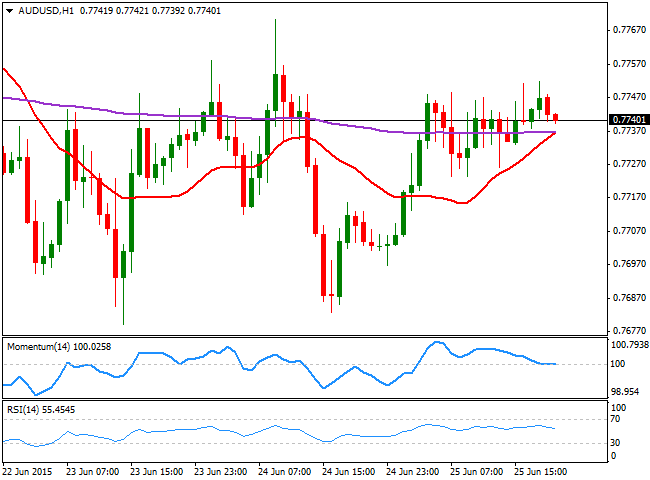
The Australian dollar trades near its daily high against the greenback, established at 0.7751. The upward potential of the Aussie has become limited, as RBA's Edwards made it clear earlier this week that the Central Bank is ready to cut rates again if the economic stalls, whilst Lagarde from the IMF, recommended also another rate cut for this year. Ahead of the Asian opening, the pair presents a neutral technical stance in the short term, as the 1 hour chart shows that the price stands a few pips above a bullish 20 SMA, whilst the technical indicators hover in neutral territory. In the 4 hours chart, the 200 EMA continues to cap the upside around 0.7760, whilst the 20 SMA maintains a slightly bearish slope below the current price, and the technical indicators also hold in neutral territory. Should the price extend beyond the mentioned EMA, the pair can extend its advance up to 0.7800, but it will take a break above 0.7840 to see a more constructive bullish tone in the AUD/USD.
Support levels: 0.7720 0.7680 0.7640
Resistance levels: 0.7760 0.7800 0.7840
Recommended Content
Editors’ Picks
AUD/USD remained bid above 0.6500

AUD/USD extended further its bullish performance, advancing for the fourth session in a row on Thursday, although a sustainable breakout of the key 200-day SMA at 0.6526 still remain elusive.
EUR/USD faces a minor resistance near at 1.0750

EUR/USD quickly left behind Wednesday’s small downtick and resumed its uptrend north of 1.0700 the figure, always on the back of the persistent sell-off in the US Dollar ahead of key PCE data on Friday.
Gold holds around $2,330 after dismal US data

Gold fell below $2,320 in the early American session as US yields shot higher after the data showed a significant increase in the US GDP price deflator in Q1. With safe-haven flows dominating the markets, however, XAU/USD reversed its direction and rose above $2,340.
Bitcoin price continues to get rejected from $65K resistance as SEC delays decision on spot BTC ETF options

Bitcoin (BTC) price has markets in disarray, provoking a broader market crash as it slumped to the $62,000 range on Thursday. Meanwhile, reverberations from spot BTC exchange-traded funds (ETFs) continue to influence the market.
US economy: slower growth with stronger inflation

The dollar strengthened, and stocks fell after statistical data from the US. The focus was on the preliminary estimate of GDP for the first quarter. Annualised quarterly growth came in at just 1.6%, down from the 2.5% and 3.4% previously forecast.
