EUR/USD Current price: 1.0955
View Live Chart for the EUR/USD

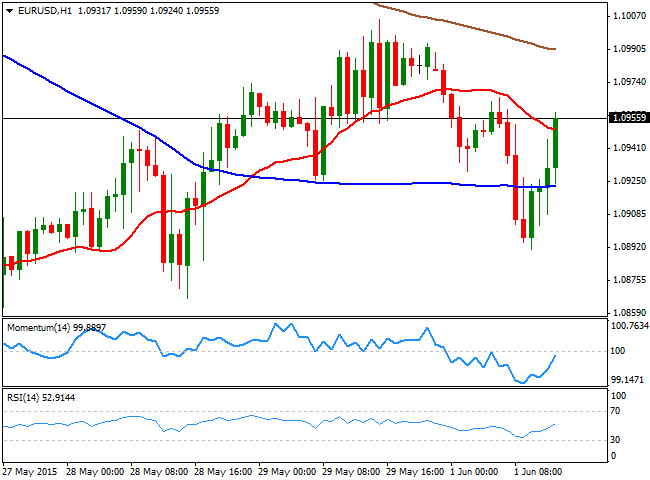
The common currency is under pressure this Monday, once again undermined by uncertainty surrounding Greece and the due payments to the IMF for this June. During the weekend, news that the country may eased back in its anti-austerity measures were firmly denied by PM Tsipras in an interview with a French newspaper. Local share markets opened in the red, dragging lower US futures ahead of the opening. In the fundamental front, European Markit Manufacturing PMIs for May resulted for the most encouraging across the old continent, but German and the EU data missed expectations. Nevertheless, growth in the region remains steady. Inflation in Germany came out at as expected in May, up 0.1% monthly basis. There were also some rumors on a Greek deal to be announced later on today, still unconfirmed that triggering an EUR/USD rally up to 1.0945 after the pair fell as low as 1.0890 mid European morning. In the US, personal income surged 0.4% in May, but spending remain flat at 0.0% on April, suggesting consumers are not ready to spend and therefore, limiting chances of an economic recovery. The EUR/USD pair extended its advance beyond the 1.0950 level, and the 1hour chart shows that the price aims to advance beyond its 20 SMA, whilst the technical indicators turned higher, but remain below their mid-lines. In the 4 hours chart, the technical indicators are bouncing from their mid-lines whilst the price moves back and forth around a flat 20 SMA, presenting an overall neutral stance.
Support levels: 1.0950 1.0900 1.0860
Resistance levels: 1.1000 1.1050 1.1090
GBP/USD Current price: 1.5234
View Live Chart for the GBP/USD
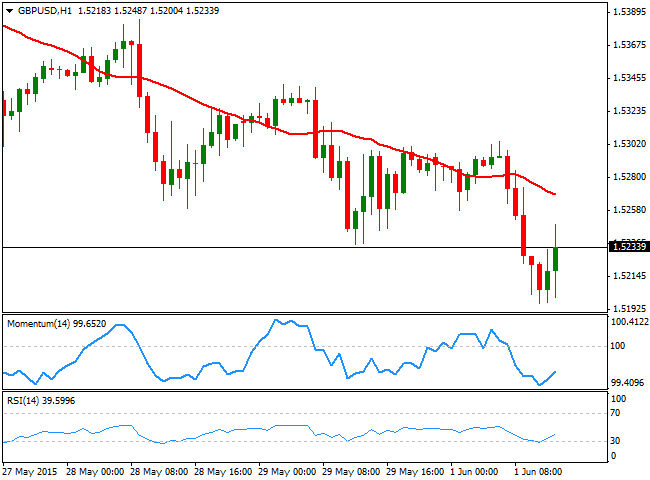
The British Pound continued falling against its rivals, as the UK manufacturing expanded at a lower-than-expected pace in May, printing 52.00 against expectations of 52.5. April reading was revised lower, which resulted in the GBP/USD extending its decline through the 1.5200 level for the first time since early May. The pair posted a limited bounce after US data, but maintains a negative tone, as the 1 hour chart shows that the price develops below a bearish 20 SMA whilst the technical indicators are barely recovering from oversold levels. In the 4 hours chart the 20 SMA maintains a strong bearish slope around 1.5300, whilst the technical indicators also aim higher in negative territory. Nevertheless, unless a clear recovery beyond 1.5330, the pair will likely remain under pressure, with sellers taking their chances at higher levels.
Support levels: 1.5260 1.5220 1.5180
Resistance levels: 1.5330 1.5365 1.5400
USD/JPY Current price: 123.97
View Live Chart for the USD/JPY
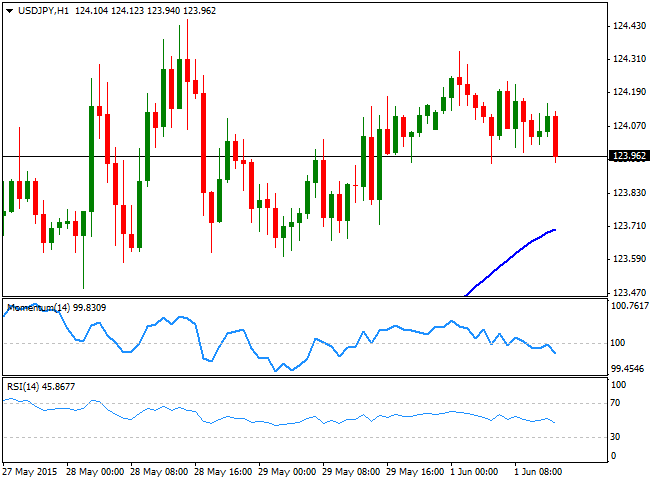
The USD/JPY pair traded mute around the 124.00 level, ever since the week started, consolidating its latest gains for most of the first two sessions of the day. The 1 hour chart shows that the 100 SMA advanced further below the current price after latest consolidation, offering now a strong dynamic support around 123.70. Tepid US data is pressuring the pair that now challenges the 124.00 figure, whilst the technical indicators are turning lower below their mid-lines, supporting some additional short term declines, furthermore considering stocks are under pressure worldwide. In the 4 hours chart, the RSI indicator is retracing from overbought territory whilst the Momentum indicator pressures its mid-line, all of which supports additional short term declines that will anyway attract buying interest closer to the 123.00 region.
Support levels: 123.65 123.30 122.90
Resistance levels: 124.45 124.85 125.10
AUD/USD Current price: 0.7645
View Live Chart for the AUD/USD
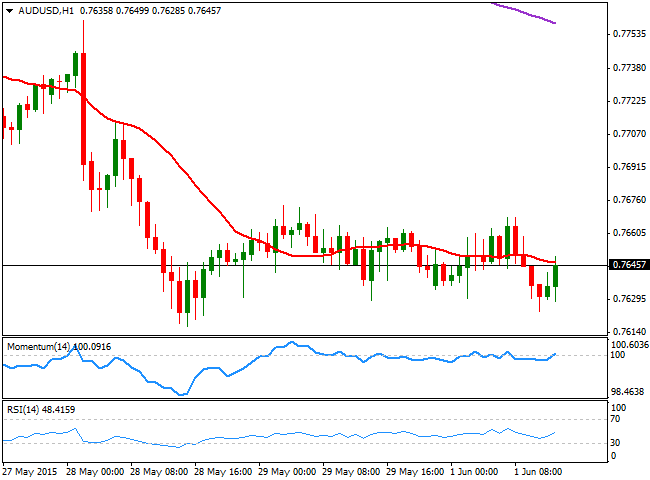
The AUD/USD pair consolidated near a daily low set a 0.7623, trading in quite a limited range ahead of upcoming RBA meeting early Tuesday with the Asian opening. The pair has been on a tear ever since a local budget suggested falling metals will continue to affect the economy to the downside, and therefore force the Central Bank to cut rates again this year. Nevertheless, its seem too early for such announcement as soon as today, which means the pair may get a boost then, if the RBA remains on hold. Technically, the 1 hour chart shows that the price develops below a flat 20 SMA, whilst the technical indicators aim higher around their mid-lines, lacking upward strength. In the 4 hours chart the 20 SMA maintains a strong bearish slope around 0.7660, whilst the technical indicators remain below their mid-lines, suggesting the upside will remain limited as long as below the mentioned 0.7660 level.
Support levels: 0.7615 0.7580 0.7530
Resistance levels: 0.7660 0.7690 0.7730
Recommended Content
Editors’ Picks
EUR/USD regains traction, recovers above 1.0700

EUR/USD regained its traction and turned positive on the day above 1.0700 in the American session. The US Dollar struggles to preserve its strength after the data from the US showed that the economy grew at a softer pace than expected in Q1.
GBP/USD returns to 1.2500 area in volatile session

GBP/USD reversed its direction and recovered to 1.2500 after falling to the 1.2450 area earlier in the day. Although markets remain risk-averse, the US Dollar struggles to find demand following the disappointing GDP data.
Gold holds around $2,330 after dismal US data

Gold fell below $2,320 in the early American session as US yields shot higher after the data showed a significant increase in the US GDP price deflator in Q1. With safe-haven flows dominating the markets, however, XAU/USD reversed its direction and rose above $2,340.
XRP extends its decline, crypto experts comment on Ripple stablecoin and benefits for XRP Ledger

Ripple extends decline to $0.52 on Thursday, wipes out weekly gains. Crypto expert asks Ripple CTO how the stablecoin will benefit the XRP Ledger and native token XRP.
After the US close, it’s the Tokyo CPI

After the US close, it’s the Tokyo CPI, a reliable indicator of the national number and then the BoJ policy announcement. Tokyo CPI ex food and energy in Japan was a rise to 2.90% in March from 2.50%.