EUR/USD Current price: 1.0976
View Live Chart for the EUR/USD
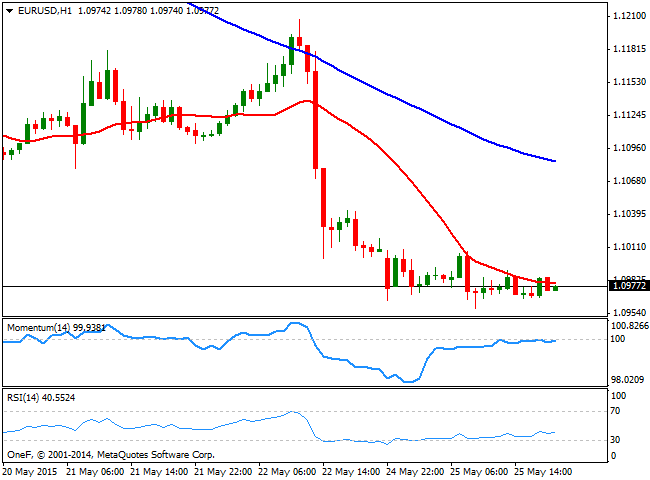
Different holidays in Europe and in the US have taken their toll over the forex market that remained for the most mute during both sessions. During the Asian session, the dollar managed to advance against all of its rivals, with the EUR/USD reaching a fresh 4-week low of 1.0958. The macroeconomic calendar was empty, with only a couple of speeches from FED members scheduled for the day. FED'S Cleveland President Mester and FED's vice chair Stanley Fischer, both made vague comments about an upcoming rate hike, should data came according to expectations, but there was no market reaction to the news.
Technically, the EUR/USD 1 hour chart shows that the price hovers in a 20 pips range around its 20 SMA, whilst the technical indicators have turned flat, the Momentum indicator around the 100 level and the RSI indicator near oversold levels. In the 4 hours chart, the 20 SMA maintains a strong bearish slope now around the 1.1050 region, whilst the technical indicators lack directional strength in negative territory. The sentiment towards the pair is negative, favoring additional declines for the upcoming sessions, particularly on a break below the mentioned daily low.
Support levels: 1.0960 1.0920 1.0870
Resistance levels: 1.1000 1.1050 1.1100
EUR/JPY Current price: 133.38
View Live Chart for the EUR/JPY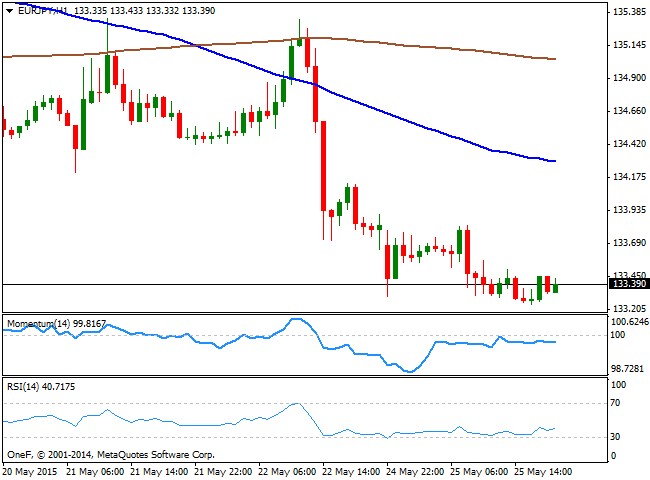
The EUR/JPY extended its decline on EUR weakness, down to 133.24 before settling a handful of pips above the level. Consolidating in a tight range due to the lack of volume, the pair maintains its short term bearish stance, as the price develops well below its 100 and 200 SMAs in the 1 hour chart, whilst the technical indicators hold in negative territory. In the 4 hours chart, the technical indicators are presenting limited upward slopes well into negative territory, rather correcting oversold readings than suggesting an upcoming recovery. This month low is set at 133.10, which means a downward acceleration below the level, may trigger some stops and fuel the decline towards the 132.20 region.
Support levels: 133.10 132.65 132.20
Resistance levels: 133.70 134.30 134.70
GBP/USD Current price: 1.5470
View Live Chart for the GBP/USD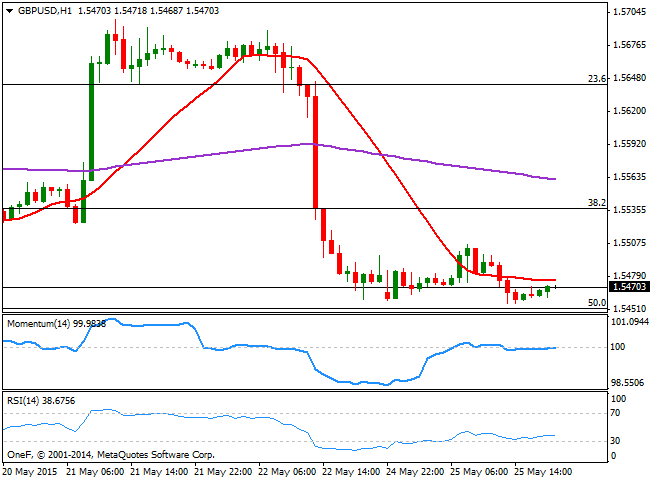
The British Pound traded as low as 1.5456 against the greenback, with the pair unable to regain the 1.5500 level, despite an early short-lived rally up to 1.5506. Technically, the 1 hour cart shows that the price is a few pips below a horizontal 20 SMA, whilst the technical indicators are also flat, although the risk remains to the downside considering the RSI holds around 38. In the 4 hours chart, is clear that the price stalled a few pips above a critical static support, the 50% retracement of the 1.5088/1.5814 rally at 1.5440, from where the pair managed to regain the upside on a test earlier this month. In the same chart, the 20 SMA maintains its bearish slope around 1.5560, whilst the technical indicators are barely regaining the upside near oversold territory, far from suggesting an upcoming bullish correction. Should the price extend below the mentioned 1.5440 once the market it's in full-volume mode, the risk turns towards fresh lows below the 1.5400 figure, eyeing an approach to the 1.5360 region, the 61.8% retracement of the mentioned rally.
Support levels: 1.5440 1.5400 1.5360
Resistance levels: 1.5495 1.5535 1.5560
USD/JPY Current price: 121.49
View Live Chart for the USD/JPY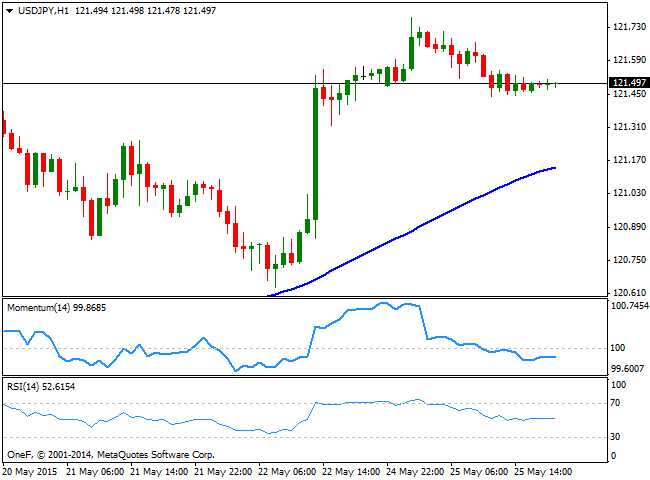
The USD/JPY pair closed the day flat around 121.50, although managed to extend to a fresh monthly high of 121.77 during the previous Asian session, with the Japanese Yen weakening, despite the country's trade balance for April posted a lower deficit than expected, printing ¥ -208.68B against previous ¥ -351.1bn. Nevertheless, the pair holds to its recent gains, and the 1 hour chart shows that the price stands well above a bullish 100 SMA, currently at 121.10, whilst the 200 SMA stands in the 120.30 region. In the same chart however, the technical indicators are flat in neutral territory. In the 4 hours chart, the Momentum indicator heads higher above the 100 level, whilst the RSI stands flat around 64, supporting additional advances for the upcoming hours, as long as retracements found buyers around the 121.00/20 region. The year high stands at 122.02, and a break above it should confirm a midterm bullish continuation, towards the 125.00 region.
Support levels: 121.10 120.85 120.45
Resistance levels: 121.60 122.10 122.50
AUD/USD Current price: 0.7824
View Live Chart for the AUD/USD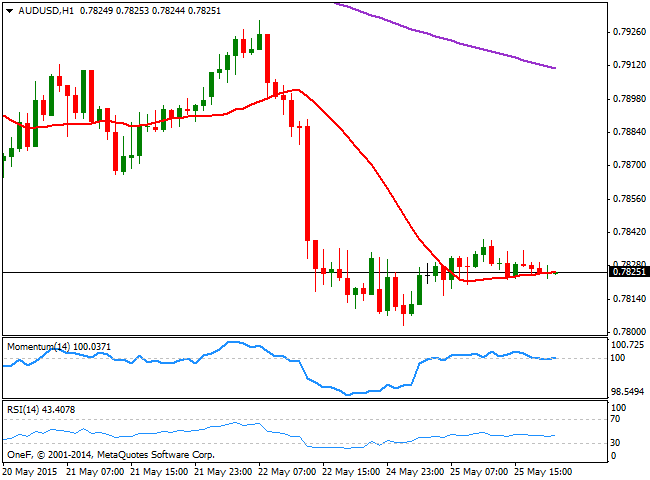
The AUD/USD pair has spent the day consolidating a few pips above the 0.7800 figure, nearing a 3-week low set at 0.7788 last May 5th. The pair has turned bearish after reaching 0.8162 mid May, pressured by the imbalance between both Central Banks: whilst the RBA has reopened doors for another rate cut this year, FED's Yellen has said last Friday that the Fed is on track to hike rates sometime this year. The short term picture is neutral, with the 1 hour chart showing that the price hovers around a flat 20 SMA, whilst the Momentum indicator is horizontal around 100 and the RSI indicator heads slightly lower around 42. In the 4 hours chart however, the bearish bias prevails with the 20 SMA maintaining a strong bearish slope above the current price and having crossed below the 200 EMA, whilst the technical indicators head lower below their mid-lines, supporting the dominant bearish trend.
Support levels: 0.7790 0.7750 0.7710
Resistance levels: 0.7845 0.7890 0.7930
Recommended Content
Editors’ Picks
EUR/USD holds above 1.0650 after US data

EUR/USD retreats from session highs but manages to hold above 1.0650 in the early American session. Upbeat macroeconomic data releases from the US helps the US Dollar find a foothold and limits the pair's upside.
GBP/USD retreats toward 1.2450 on modest USD rebound

GBP/USD edges lower in the second half of the day and trades at around 1.2450. Better-than-expected Jobless Claims and Philadelphia Fed Manufacturing Index data from the US provides a support to the USD and forces the pair to stay on the back foot.
Gold clings to strong daily gains above $2,380

Gold trades in positive territory above $2,380 on Thursday. Although the benchmark 10-year US Treasury bond yield holds steady following upbeat US data, XAU/USD continues to stretch higher on growing fears over a deepening conflict in the Middle East.
Ripple faces significant correction as former SEC litigator says lawsuit could make it to Supreme Court

Ripple (XRP) price hovers below the key $0.50 level on Thursday after failing at another attempt to break and close above the resistance for the fourth day in a row.
Have we seen the extent of the Fed rate repricing?

Markets have been mostly consolidating recent moves into Thursday. We’ve seen some profit taking on Dollar longs and renewed demand for US equities into the dip. Whether or not this holds up is a completely different story.