EUR/USD Current price: 1.0772
View Live Chart for the EUR/USD

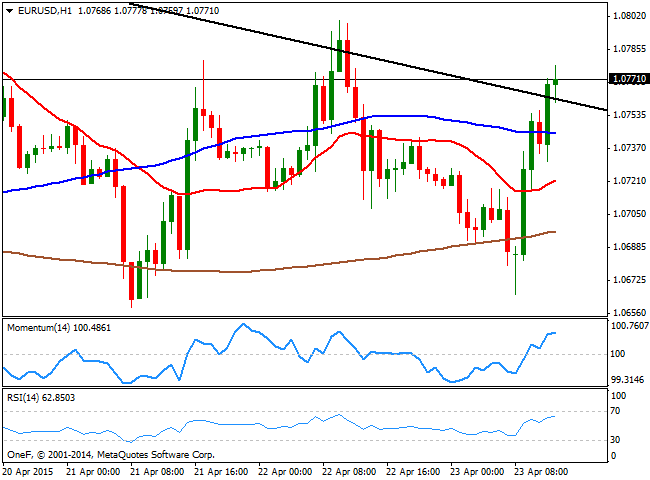
The EUR/USD pair trades at fresh daily highs in the 1.0770 region, recovering from a daily low of 1.0665, reached after weaker-than-expected European Markit Services and Manufacturing readings. There was no catalyst behind the latest recovery, but probably some profit taking around the base of this week range, as the pair is unable to set a clear directional move. US weekly unemployment claims grew to 295K last week, keeping the greenback under pressure. Short term, the 1 hour chart shows that the price recovered above its moving averages that anyway remain horizontal, and extended above a daily descendant trend line coming from this month high of 1.1034. In the same chart, the technical indicators maintain a bullish tone in positive territory, supporting some additional advances up to 1.0800, yesterday's high. In the 4 hours chart the technical indicators head strongly higher above their mid-lines, supporting the shorter term view.
Support levels: 1.0760 1.0730 1.0700
Resistance levels: 1.0800 1.0845 1.0880
GBP/USD Current price: 1.5028
View Live Chart for the GBP/USD
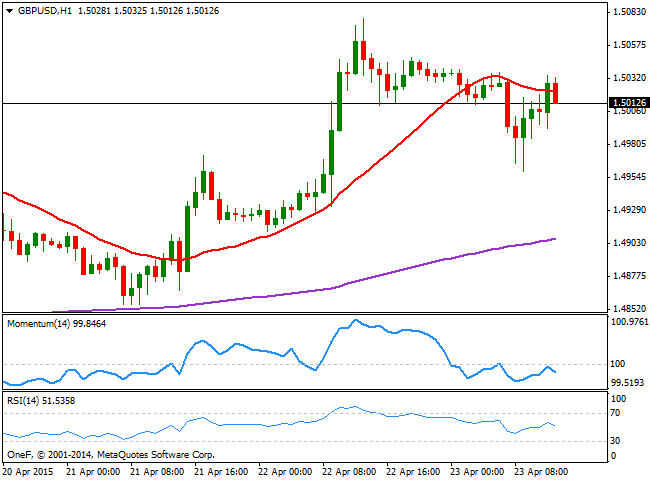
The GBP/USD pair firms above the 1.5000 level after a short-lived deep to 1.4959 on the back of weaker UK Retail Sales in March, due to falling fuel sales. The 1 hour chart shows however, presents a bearish technical tone, as the price moves back and forth around a flat 20 SMA, whilst the technical indicators are retracing from their mid-lines, and gaining bearish slope. In the 4 hours chart, the price held above its moving averages, whilst the technical indicators head higher in positive territory, all of which suggest the pair can extend its advance un to the 1.5100 price zone.
Support levels: 1.5000 1.4970 1.4930
Resistance levels: 1.5050 1.5110 1.5165
USD/JPY Current price: 120.00
View Live Chart for the USD/JPY
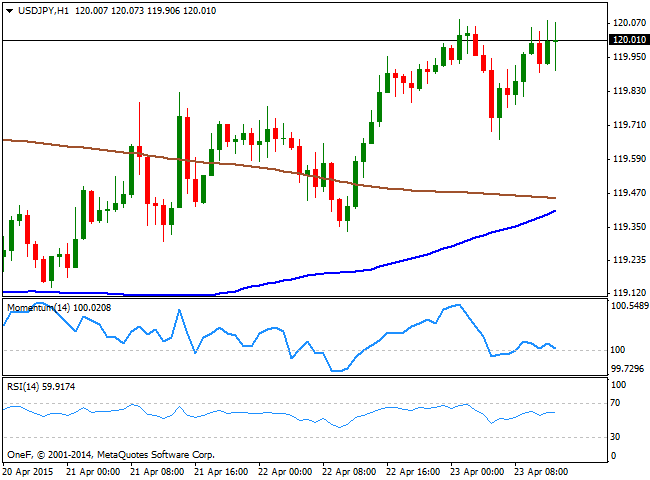
The USD/JPY pair struggles to regain the 120.00 level, having set a daily high at 120.08 so far today. The short term picture shows that the price extended further above its moving averages, with the 100 SMA about to cross the 200 SMA to the upside, albeit the technical indicators lack directional strength at the time being. In the 4 hours chart the pair is finding intraday resistance in a flat 200 SMA, whilst the Momentum indicator is losing upward strength, but holding in positive territory, whilst the RSI indicator aims higher around 62. A price acceleration through the daily high should favor additional advances towards 120.85, a strong static resistance level.
Support levels: 119.60 119.20 118.90
Resistance levels: 120.10 120.50 120.85
AUD/USD Current price: 0.7724
View Live Chart for the AUD/USD
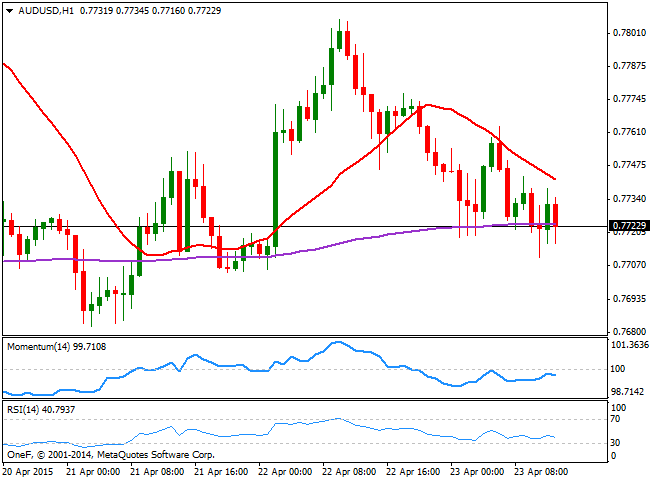
The AUD/USD pair trades lower in range, finding so far short term buying interest in the 0.7700/10 region. Technically, the pair presents a bearish tone, as the 1 hour chart shows that the price develops below a bearish 20 SMA, whilst the technical indicators head lower below their mid-lines. In the 4 hours chart the 20 SMA capped the upside and maintains a bearish tone around 0.7740 now, whilst the technical indicators maintain a neutral stance. Also, the price holds a few pips above its 200 EMA, which so far limits the downside. Nevertheless, a break below the mentioned 0.7705 price zone, should lead to a steadier decline, regardless of dollar's weakness against its European rivals.
Support levels: 0.7705 0.7665 0.7620
Resistance levels: 0.7740 0.7770 0.7800
Recommended Content
Editors’ Picks
EUR/USD clings to gains near 1.0700, awaits key US data

EUR/USD clings to gains near the 1.0700 level in early Europe on Thursday. Renewed US Dollar weakness offsets the risk-off market environment, supporting the pair ahead of the key US GDP and PCE inflation data.
USD/JPY keeps pushing higher, eyes 156.00 ahead of US GDP data

USD/JPY keeps breaking into its highest chart territory since June of 1990 early Thursday, recapturing 155.50 for the first time in 34 years as the Japanese Yen remains vulnerable, despite looming intervention risks. The focus shifts to Thursday's US GDP report and the BoJ decision on Friday.
Gold price lacks firm intraday direction, holds steady above $2,300 ahead of US data

Gold price remains confined in a narrow band for the second straight day on Thursday. Reduced Fed rate cut bets and a positive risk tone cap the upside for the commodity. Traders now await key US macro data before positioning for the near-term trajectory.
Injective price weakness persists despite over 5.9 million INJ tokens burned

Injective price is trading with a bearish bias, stuck in the lower section of the market range. The bearish outlook abounds despite the network's deflationary efforts to pump the price. Coupled with broader market gloom, INJ token’s doomed days may not be over yet.
Meta takes a guidance slide amidst the battle between yields and earnings

Meta's disappointing outlook cast doubt on whether the market's enthusiasm for artificial intelligence. Investors now brace for significant macroeconomic challenges ahead, particularly with the release of first-quarter gross domestic product (GDP) data on Thursday.