EUR/USD Current price: 1.0732
View Live Chart for the EUR/USD
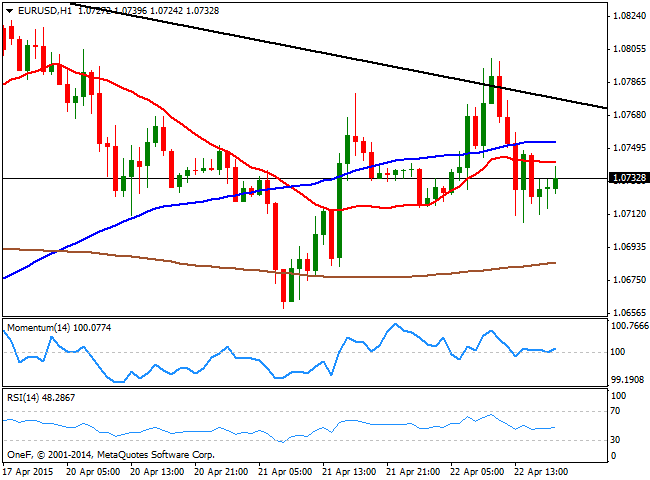
In another volatile journey, the EUR/USD pair closed the day again unchanged, with the daily chart showing two dojis in a row. In Europe, the most relevant news came were related to Greece, as ECB's Executive Board Member Benoit Coeure said earlier in the day that the Central Bank will continue to fund Greek banks, as long as they stay solvent and have enough collateral. Besides, the country is said to have enough liquidity to face upcoming payments, and to get into June. The current bailout extension ends on June 30. On a negative note, talks are that the country won't present a reform list at Riga, during the upcoming Eurogroup meeting this weekend. The initial optimism that sent the pair up to a daily high of 1.0800 was diluted during the American afternoon, and the dollar gained further after sales of Existing Homes in the US rose to their highest level since 2013.
The EUR/USD technical picture shows that the pair has failed to sustain gains beyond a daily descendant trend line coming from this April high set at 1.1034, whilst at the same time, buying interest surged around 1.0710, now the immediate support. Short term, the 1 hour chart shows that the price stands below its 20 and 100 SMAs, both in a tight 20 pips range, which reflects the lack of a clear direction whilst the technical indicators stand flat in neutral territory. In the 4 hours chart, the moving averages converge in the 1.0750, whilst the technical indicators hover around their mid-lines, showing no directional strength. Should the price accelerate below the mentioned 1.0710 level, the pair may extend its decline, eyeing 1.0630 as a probable bearish target.
Support levels: 1.0710 1.0680 1.0630
Resistance levels: 1.0770 1.0810 1.0850
EUR/JPY Current price: 128.68
View Live Chart for the EUR/JPY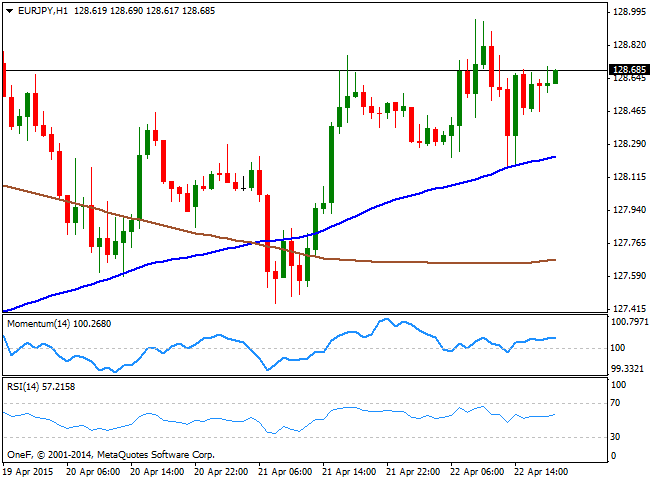
A weaker Japanese yen helped the EUR/JPY surge to an intraday high of 128.95, albeit the pair retreated from the level, still unable to define a clearer trend. Short term, the pair presents a bullish tone, as the 1 hour chart shows that the price bounced sharply from a bullish 100 SMA, currently around 128.30, whilst the technical indicators head higher above their mid-lines. In the same chart, the distance in between 100 and 200 SMAs keeps widening, which reflects buyers are taking the lead. In the 4 hours chart the price struggles around a mild bearish 100 SMA, whilst the technical indicators head higher above their mid-lines, supporting the shorter term view.
Support levels: 128.10 127.70 127.25
Resistance levels: 129.00 129.45 129.90
GBP/USD Current price: 1.5045
View Live Chart for the GBP/USD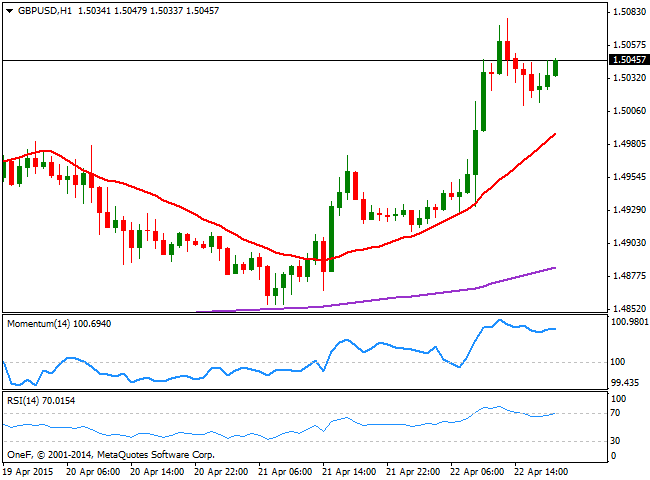
The GBP/USD pair surged to a fresh 6-week high of 1.5078 following the release of the Bank of England latest Minutes, showing that all MPC members voted to keep rates and the APP unchanged, but also agreed that the next rate move will likely be an increase. There was no date for such move, yet the line was enough to key Pound buoyed all through the session. The Minutes also stated that there's risk of negative inflation readings in the UK during the upcoming months, but policymakers expect it to pick up during next year. This Thursday, the UK will release its March Retail Sales figures, expected slightly below February ones. The GBP/USD pair held to its daily gains, with buyers surging on retracements towards the 1.5000 figure, now the immediate support. The 1 hour chart shows that the price advances above a bullish 20 SMA, whilst the technical indicators aim higher near overbought levels. In the 4 hours chart, the Momentum indicator maintains its strength above 100 whilst the RSI turned flat around overbought levels. Moving averages in this last time frame stand well below the current level, all of which supports additional advances towards the 1.5165 level, the high posted after the March FOMC meeting.
Support levels: 1.5000 1.4970 1.4930
Resistance levels: 1.5085 1.5120 1.5165
USD/JPY Current price: 119.83
View Live Chart for the USD/JPY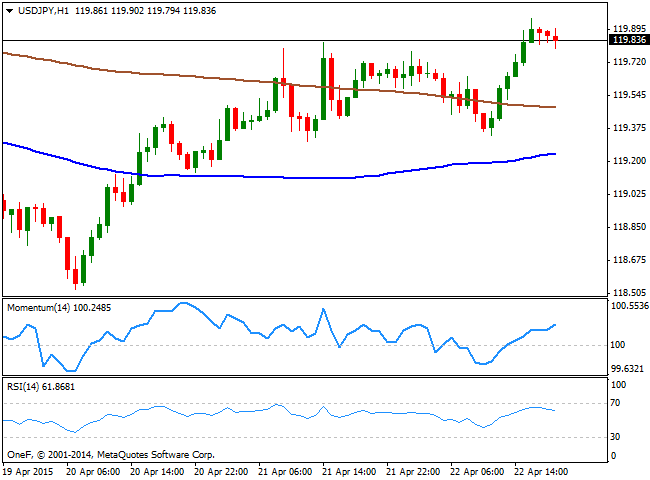
The USD/JPY pair advanced during the American session, finding support in strong US housing data, albeit the pair stalled a couple of pips below the 120.00 critical figure. The pair got an extra boost by rising US yields, with the 10 year one up 2.71% on the day and at 1.97%. Ahead of the Asian opening, the pair trades near its daily high of 119.95, and with the 1 hour chart showing that the price extended above its 100 and 200 SMAs, with the shortest below the largest, which signals little upward momentum at the time being. In the same chart, the technical indicators are losing their upward strength, but hold above their mid-lines, while in the 4 hours chart the technical indicators have turned lower in positive territory, as the price develops between horizontal moving averages. Overall, the neutral stance prevails as only some upward momentum through the 120.10 level should signal an upward continuation towards the highs in the 120.85 region.
Support levels: 119.60 119.20 118.90
Resistance levels: 120.10 120.50 120.85
AUD/USD Current price: 0.7768
View Live Chart for the AUD/USD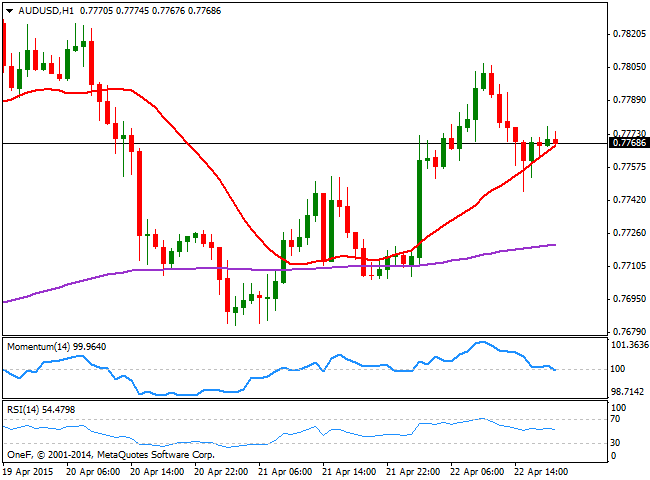
The Australian dollar rose against the greenback up to 0.7806 following the release of better-than-expected Australian inflation. The trimmed CPI yearly basis came in at 2.3% against 2.2% expected, diminishing chances of a May rate cut and therefore boosting the pair. The pair retreated intraday, but buyers contained the slide around 0.7750, now the immediate support. Technically, the 1 hour chart shows that the price holds above a bullish 20 SMA, while the technical indicators have turned flat around their mid-lines. In the 4 hours chart the price also holds above a flat 20 SMA, whilst the technical indicators aim slightly higher around their mid-lines, lacking directional strength. The pair needs to advance beyond the 0.7800 level to gain some upward momentum, albeit the critical resistance stands in the 0.7840 area, where the pair stalled multiple times over the past few months. It will take a break above this last to consider a possible rally towards the 0.7900 figure.
Support levels: 0.7750 0.7705 0.7665
Resistance levels: 0.7800 0.7840 0.7890
Recommended Content
Editors’ Picks
AUD/USD jumps above 0.6500 after hot Australian CPI data

AUD/USD extended gains and recaptured 0.6500 in Asian trading, following the release of hotter-than-expected Australian inflation data. The Australian CPI rose 1% in QoQ in Q1 against 0.8% forecast, providing extra legs to the Australian Dollar upside.
USD/JPY hangs near 34-year high at 154.88 as intervention risks loom

USD/JPY is sitting at a multi-decade high of 154.88 reached on Tuesday. Traders refrain from placing fresh bets on the pair as Japan's FX intervention risks loom. Broad US Dollar weakness also caps the upside in the major. US Durable Goods data are next on tap.
Gold price cautious despite weaker US Dollar and falling US yields

Gold retreats modestly after failing to sustain gains despite fall in US Treasury yields, weaker US Dollar. XAU/USD struggles to capitalize following release of weaker-than-expected S&P Global PMIs, fueling speculation about potential Fed rate cuts.
Crypto community reacts as BRICS considers launching stablecoin for international trade settlement

BRICS is intensifying efforts to reduce its reliance on the US dollar after plans for its stablecoin effort surfaced online on Tuesday. Most people expect the stablecoin to be backed by gold, considering BRICS nations have been accumulating large holdings of the commodity.
US versus the Eurozone: Inflation divergence causes monetary desynchronization

Historically there is a very close correlation between changes in US Treasury yields and German Bund yields. This is relevant at the current juncture, considering that the recent hawkish twist in the tone of the Fed might continue to push US long-term interest rates higher and put upward pressure on bond yields in the Eurozone.