EUR/USD Current price: 1.0823
View Live Chart for the EUR/USD
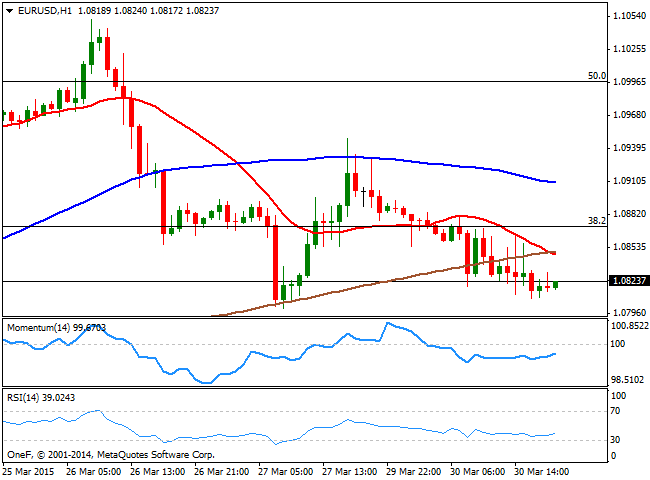
The American dollar staged a strong come back this Monday, surging across the board ever since the day started, and rallying alongside with stocks. The EUR/USD pair traded as low as 1.0810 in the day, consolidating near the level ahead of US session´s close. But it was a quite choppy session, with the pair moving suddenly up and down with speculation as the only driver. During the European morning, Germany released its inflation rates, with the CPI monthly basis at 0.5% in February, for the most matching expectations, but weak. In the US, the price index for personal consumption expenditures rose by 0.3% from a year earlier, signaling inflation remains subdued, while pending home sales in February increased to their highest level since June 2013.
Technically, the pair remained below the 1.0865 Fibonacci level ever since broking below it during Asian hours, with sellers surging on intraday attempts to break higher. The 1 hour chart shows that the price broke below its 100 SMA that now converges with the 20 SMA around 1.0845, whilst the technical indicators stand flat below their mid-lines. In the 4 hours chart the price extended further below a bearish 20 SMA, whilst the Momentum indicator aims higher below 100 and the RSI indicator maintains a bearish slope around 41, anticipating additional declines, particularly if the price extends below the 1.0800 level.
Support levels: 1.0790 1.0755 1.0710
Resistance levels: 1.0865 1.0910 1.0950
EUR/JPY Current price: 129.97
View Live Chart for the EUR/JPY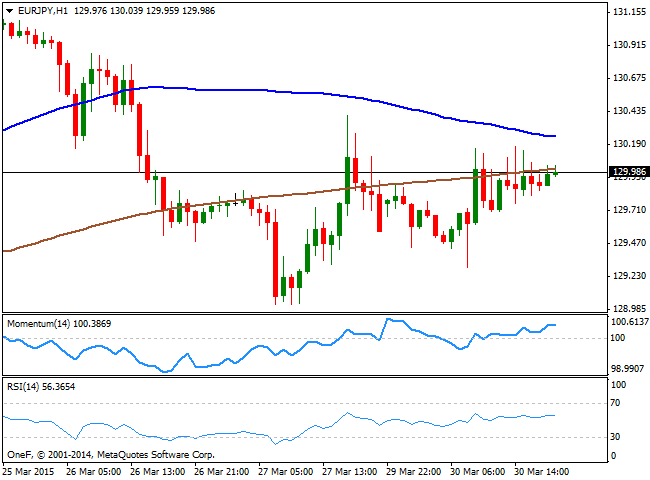
The yen fell on the back of disappointing local data, as Japanese industrial production collapsed -3.4% monthly basis verse -1.9% expected in February. The decline was broad-based, but critically focused in key export industries. The EUR/JPY cross however, failed to regain the 130.00 level, despite several intraday attempts. In the short term, the 1 hour chart shows that the price remains limited below its 200 SMA, with the 100 SMA offering additional resistance in the 130.35 price zone, the immediate resistance level. In the same chart, the technical indicators stand directionless above their mid-lines, offering little clues on what's next for the pair. In the 4 hours chart, the price is right above a bearish 100 SMA, whilst the Momentum indicator aims higher and is about to cross its mid-line, while the RSI stands flat around 49, limiting the upward potential at the time being. The price needs to extend above 130.35 to be able to advance further, up to the 131.20 price zone.
Support levels: 129.75 129.30 128.80
Resistance levels: 130.35 130.80 131.20
GBP/USD Current price: 1.4827
View Live Chart for the GBP/USD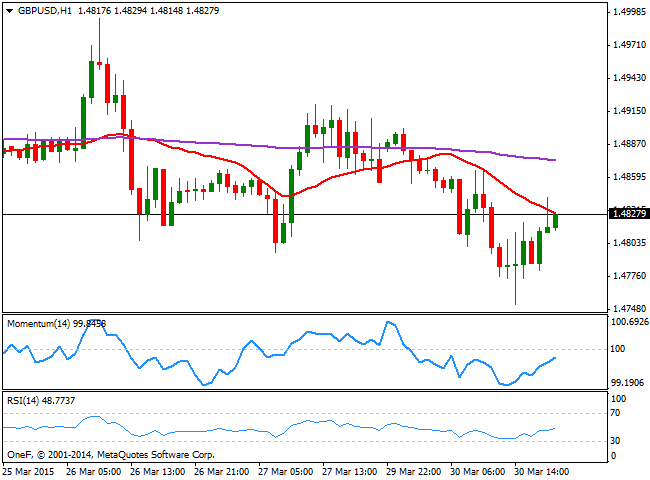
The GBP/USD pair bounced from a fresh 2-week low set at 1.4752 early Europe, now trading back above the 1.4800 level. There were no news coming from the UK, albeit on Tuesday, the kingdom will release its GDP and Current Account figures, both for the last quarter of 2014, with the first expected to remain as previously reported at 0.5%. From a technical point of view, the short term picture suggests the pair may advance further as the 1 hour chart shows that the price advances towards its 20 SMA, currently around 1.4840 whilst the technical indicators aim higher coming from oversold territory, but still below their mid-lines. In the 4 hours chart, the price also stands below a bearish 20 SMA, currently at 1.4860, while the technical indicators aim higher below their mid-lines. The price can extend up to this 20 SMA at 1.4860, but it will take some steady advances above it to confirm additional gains for the upcoming sessions. A break below 1.4790 on the other hand, should lead to a negative continuation towards the 1.4700 price zone.
Support levels: 1.4790 1.4740 1.4700
Resistance levels: 1.4840 1.4890 1.4930
USD/JPY Current price: 120.12
View Live Chart for the USD/JPY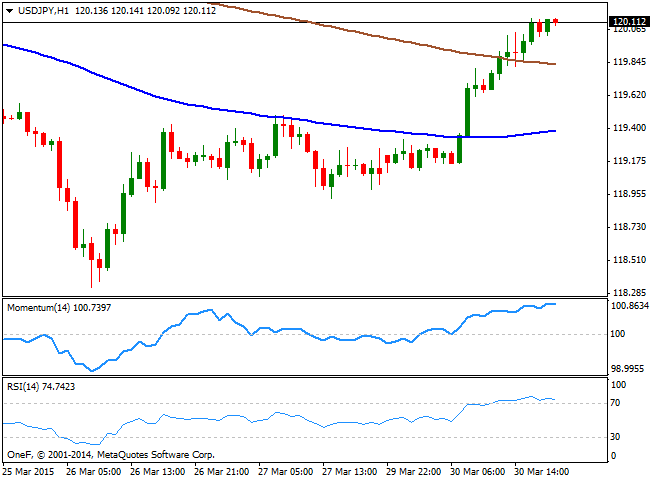
The USD/JPY pair surged above the 120.00 level in the American afternoon, supported by the strong recovery in stocks. Technically the 1 hour chart shows that the price advanced above the 100 and 200 SMAs, although indicators are starting to look exhausted in extreme overbought territory. The price however, remains at the daily high, diverging from the indicators and suggesting that if there is a bearish corrective, it may be short lived and shallow. In the 4 hours chart, the price advanced above its 200 SMA, while the Momentum indicator is turning sharply lower from overbought territory, and the RSI maintains a bullish slope around 64. As for the shorter term, the Momentum indicator divergence is not enough to confirm a change in the ongoing upward move: the pair needs to break below the 119.65 support to gain bearish track.
Support levels: 119.90 119.65 119.20
Resistance levels: 120.45 120.80 121.30
AUD/USD Current price: 0.7652
View Live Chart for the AUD/USD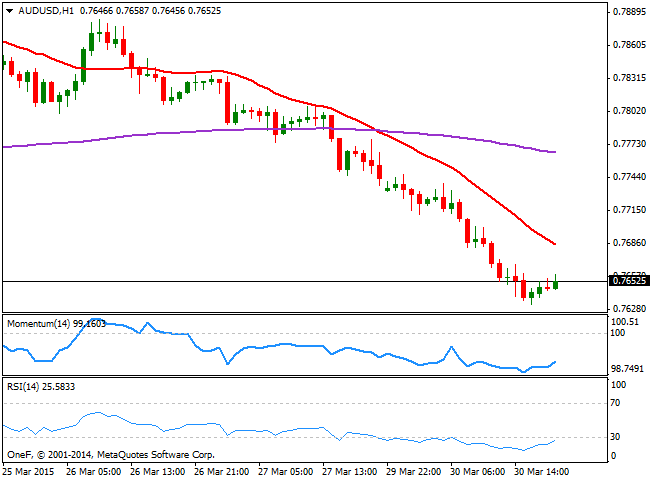
The AUD/USD pair has been under strong selling pressure all day long, as investors are pricing in the possible announcement of a rate cut coming from the RBA this month. The pair fell as low as 0.7632 before posting a limited bounce by US close, but maintains a strong negative bias. Technically the 1 hour chart shows that the price holds below a strongly bearish 20 SMA, whilst the Momentum indicator remains flat below 100 and the RSI aims higher around 24. In the 4 hours chart the 20 SMA crossed below the 200 EMA in the 0.7770/80 area, whilst the technical indicators are posting some tepid advances in overbought territory, still not enough to confirm a short term recovery. As long as below the 0.7700 figure, the downside is favored, with a break below the mentioned daily low exposing 0.7559, this year low posted early March.
Support levels: 0.7630 0.7585 0.7555
Resistance levels:0.7700 0.7745 0.7780
Recommended Content
Editors’ Picks
EUR/USD clings to daily gains above 1.0650

EUR/USD gained traction and turned positive on the day above 1.0650. The improvement seen in risk mood following the earlier flight to safety weighs on the US Dollar ahead of the weekend and helps the pair push higher.
GBP/USD recovers toward 1.2450 after UK Retail Sales data

GBP/USD reversed its direction and advanced to the 1.2450 area after touching a fresh multi-month low below 1.2400 in the Asian session. The positive shift seen in risk mood on easing fears over a deepening Iran-Israel conflict supports the pair.
Gold holds steady at around $2,380 following earlier spike

Gold stabilized near $2,380 after spiking above $2,400 with the immediate reaction to reports of Israel striking Iran. Meanwhile, the pullback seen in the US Treasury bond yields helps XAU/USD hold its ground.
Bitcoin Weekly Forecast: BTC post-halving rally could be partially priced in Premium

Bitcoin price shows no signs of directional bias while it holds above $60,000. The fourth BTC halving is partially priced in, according to Deutsche Bank’s research.
Geopolitics once again take centre stage, as UK Retail Sales wither

Nearly a week to the day when Iran sent drones and missiles into Israel, Israel has retaliated and sent a missile into Iran. The initial reports caused a large uptick in the oil price.